Introduction to Instaguard Functions
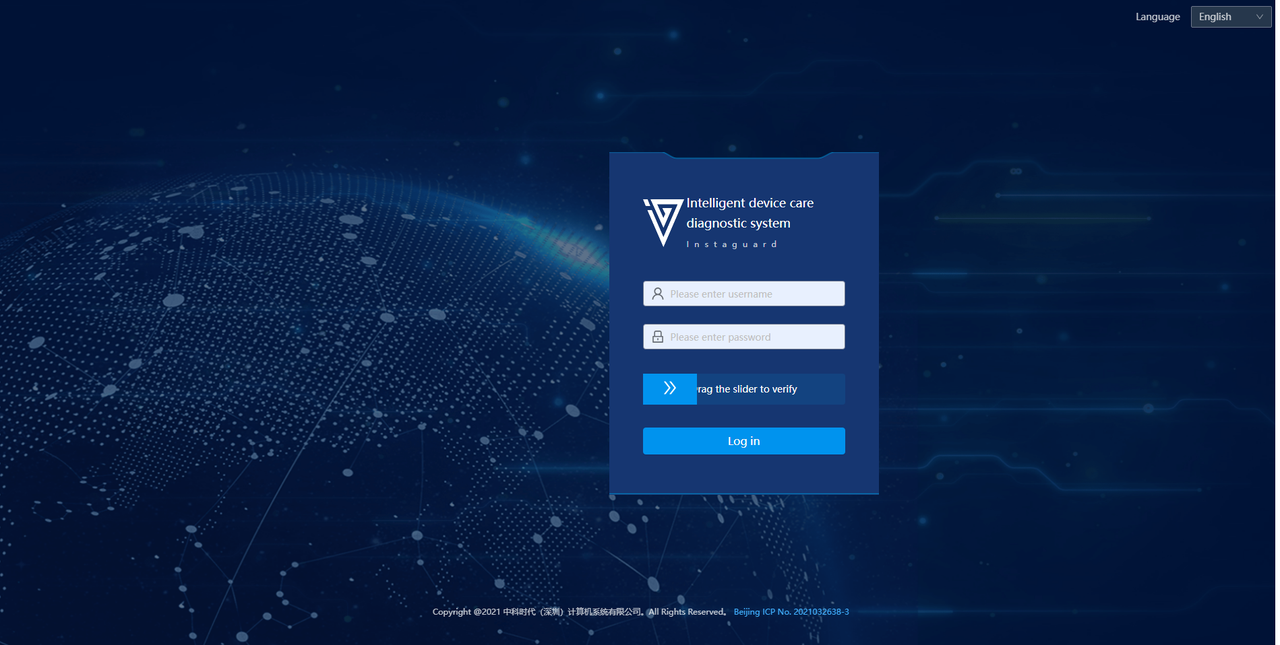
Login Page
1. Function Overview
This interface serves as the login entry for the Intelligent Device Care Diagnostic System. It realizes user identity verification through a simple interface design to ensure the security of device operations and data management.
2. Operation Process
2.1 Accessing the System
Access via a display with a resolution ≥ 1920×1080 and a Google kernel browser (version ≥ 92):
Industrial intelligent computer IP address: 20031 (e.g., 192.168.111.174:20031)
2.2 Identity Verification
Step 1: Enter the employee number/registered account in the "Username" input field.
Step 2: Enter the corresponding password in the "Password" input field (password is hidden by default).
Step 3: Drag the blue slider for verification.
Step 4: Click the blue "Login" button.
Auxiliary Functions (General)
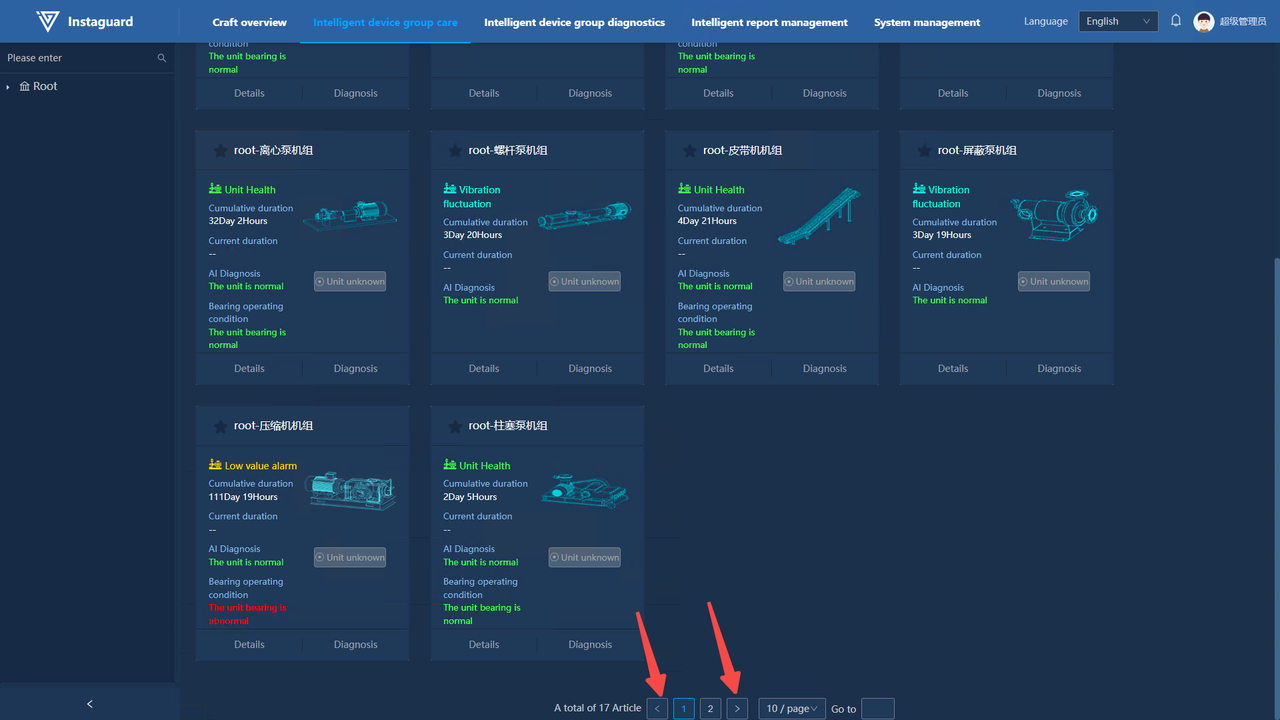
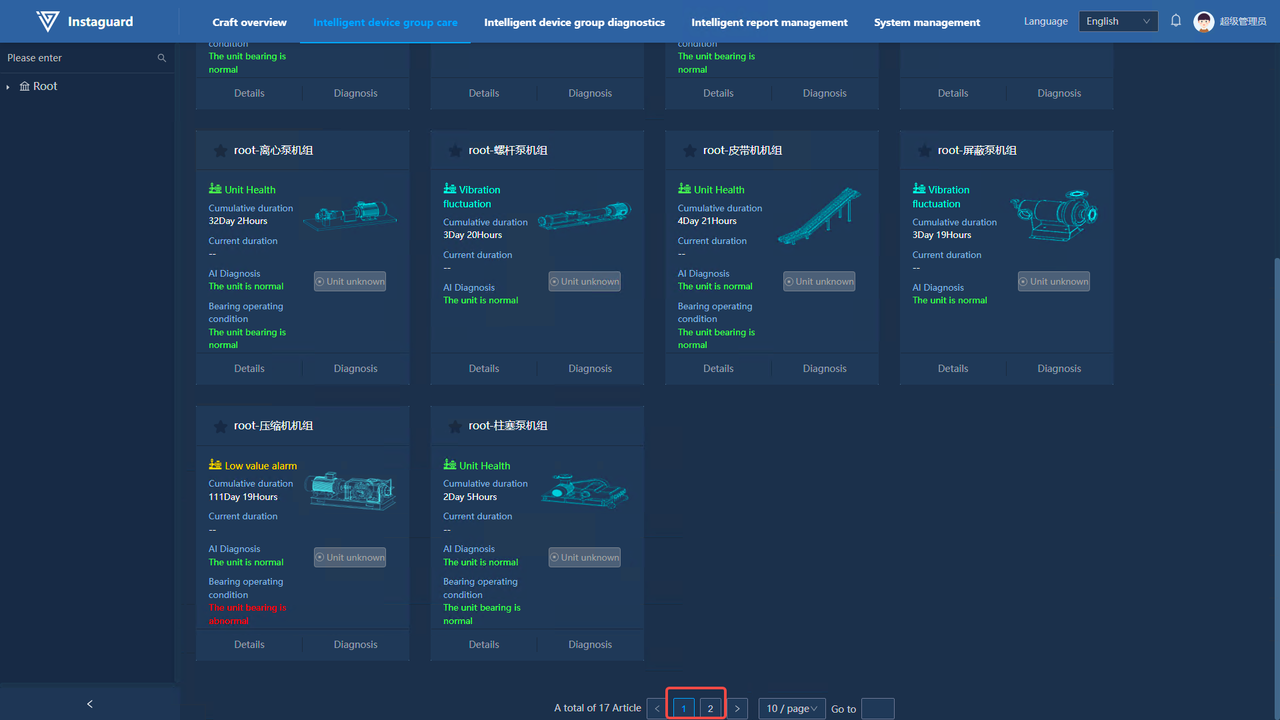
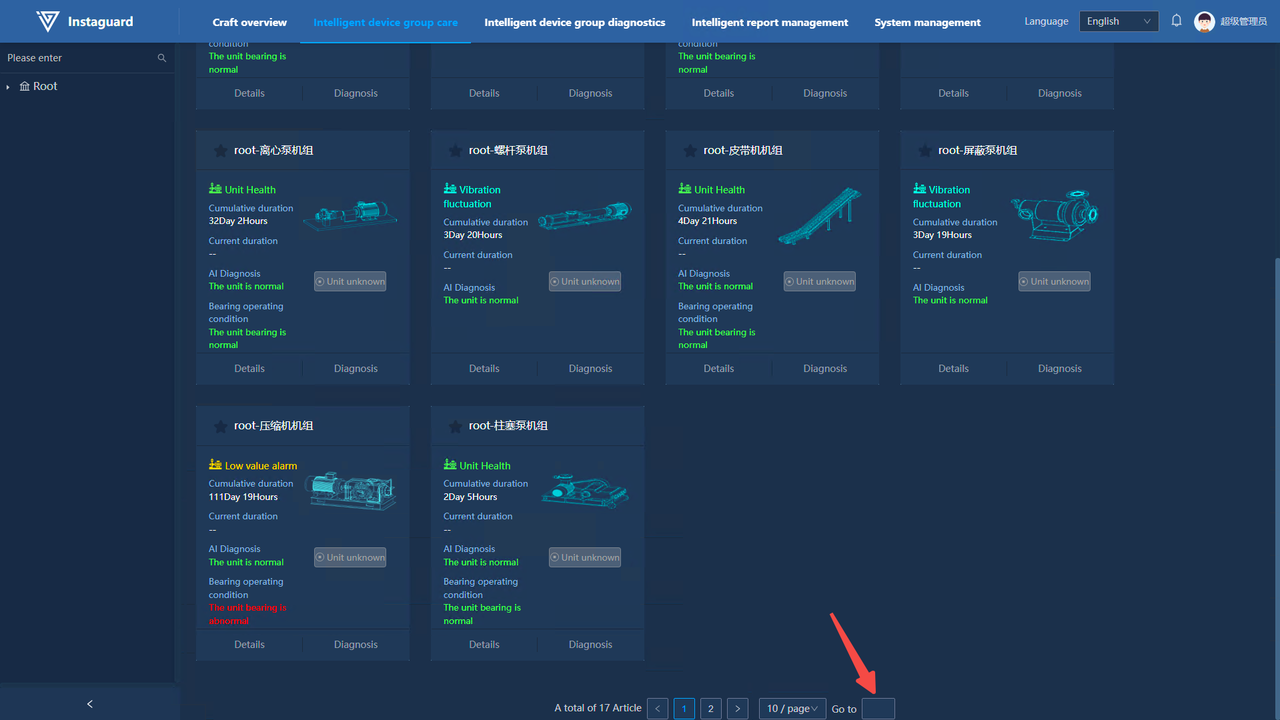
1. Pagination Control
1.1 Pagination Capacity
Switchable to display 10/20/30/40 pieces of information per page.
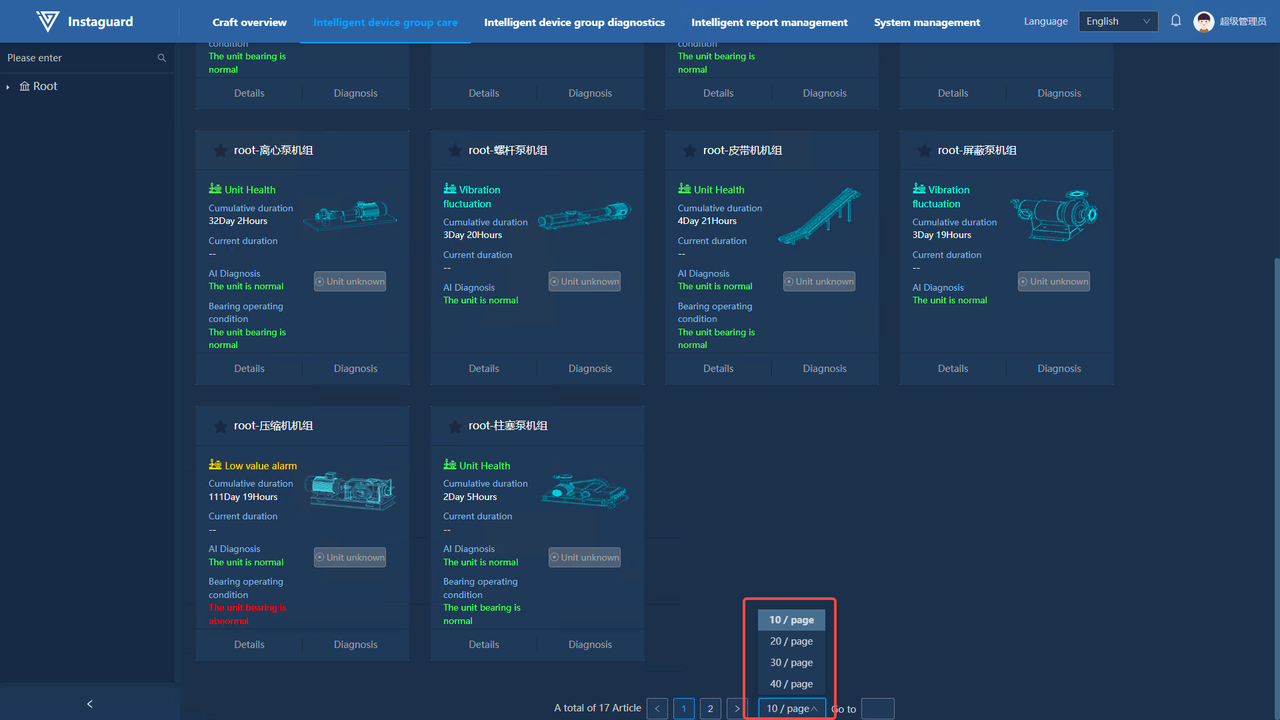
1.2 Page Navigation
-
Click the " < " " > " buttons to navigate between pages.
-
Click the page number you want to go to for direct jumping.
-
Enter the target page number in the input field for jumping.
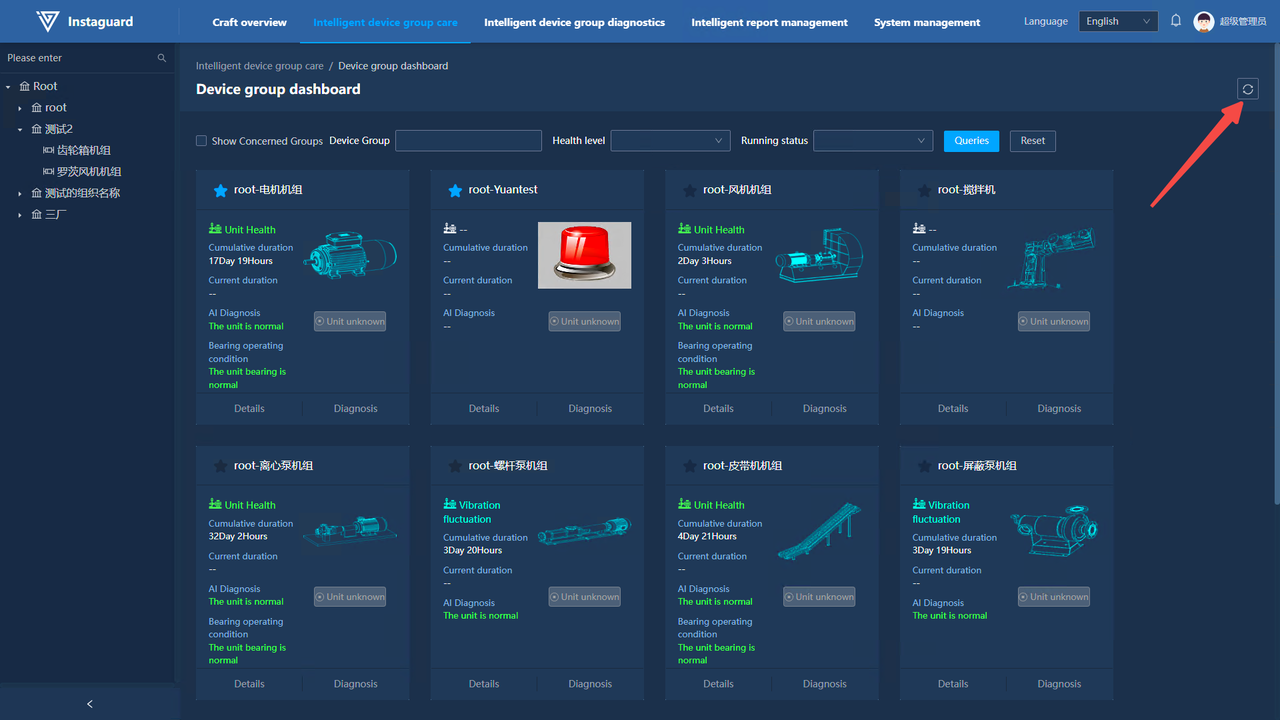
2. Filter Query
Select or enter filter criteria as prompted, then click the "Query" button. Click "Reset" to clear all criteria.
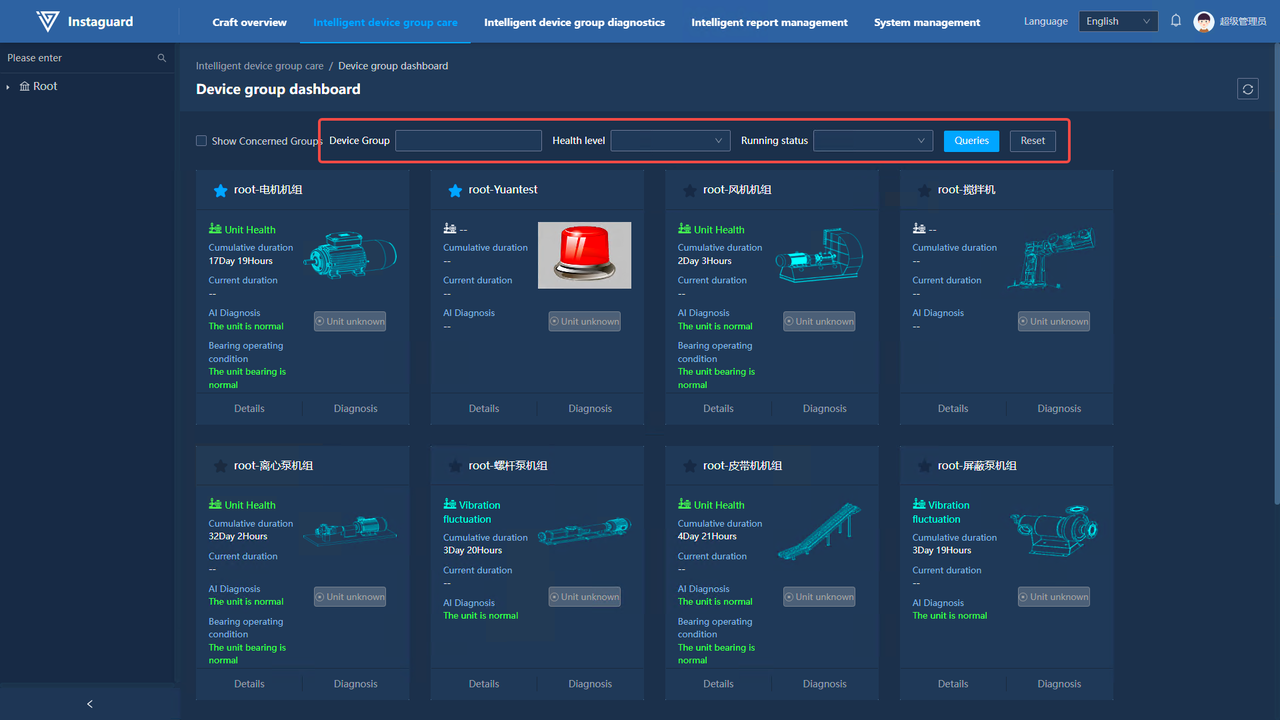
-
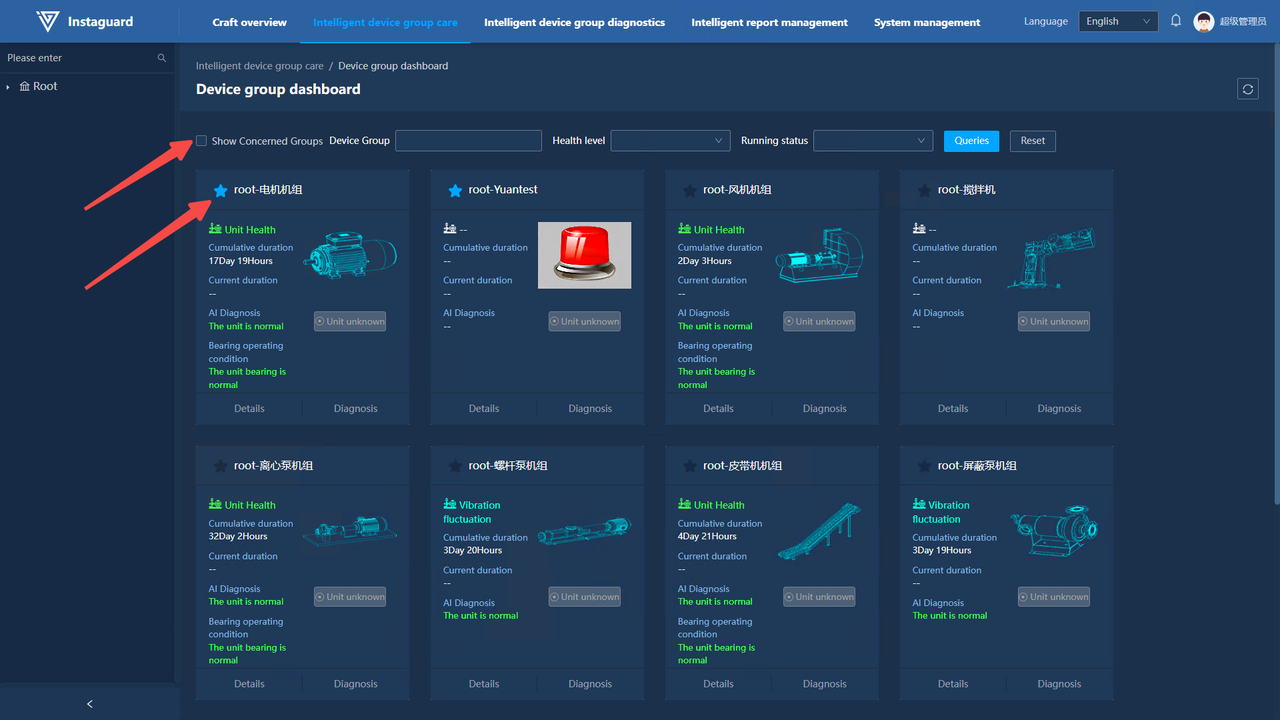
The Unit Kanban page features an exclusive "Show Followed Units Only" option. When checked, only followed units are displayed (click the asterisk before the unit name to mark it in blue for following).
-
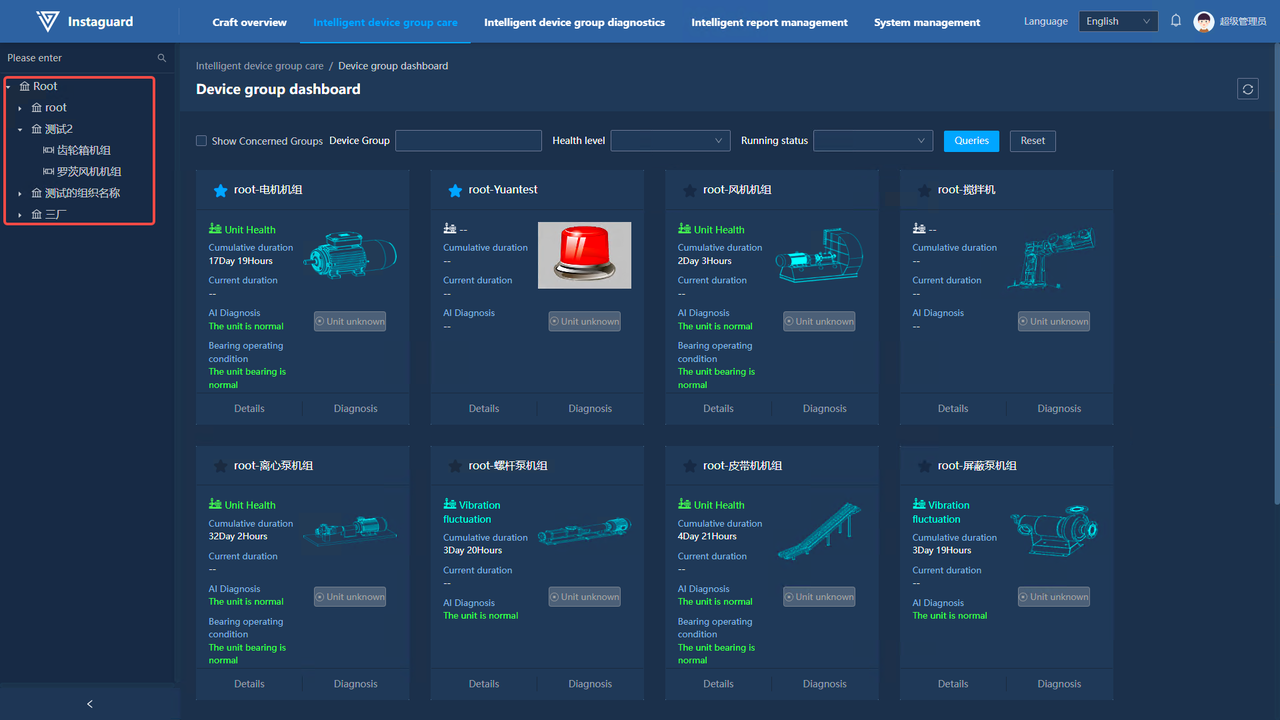
Select or perform a fuzzy search in the left organization tree to display units under the corresponding organization and its subordinates.
3. Data Refresh
Click the "Refresh" button to force an update of the page content.
4. Language Switching
Click the "Language" drop-down menu at the top to switch between Chinese and English.
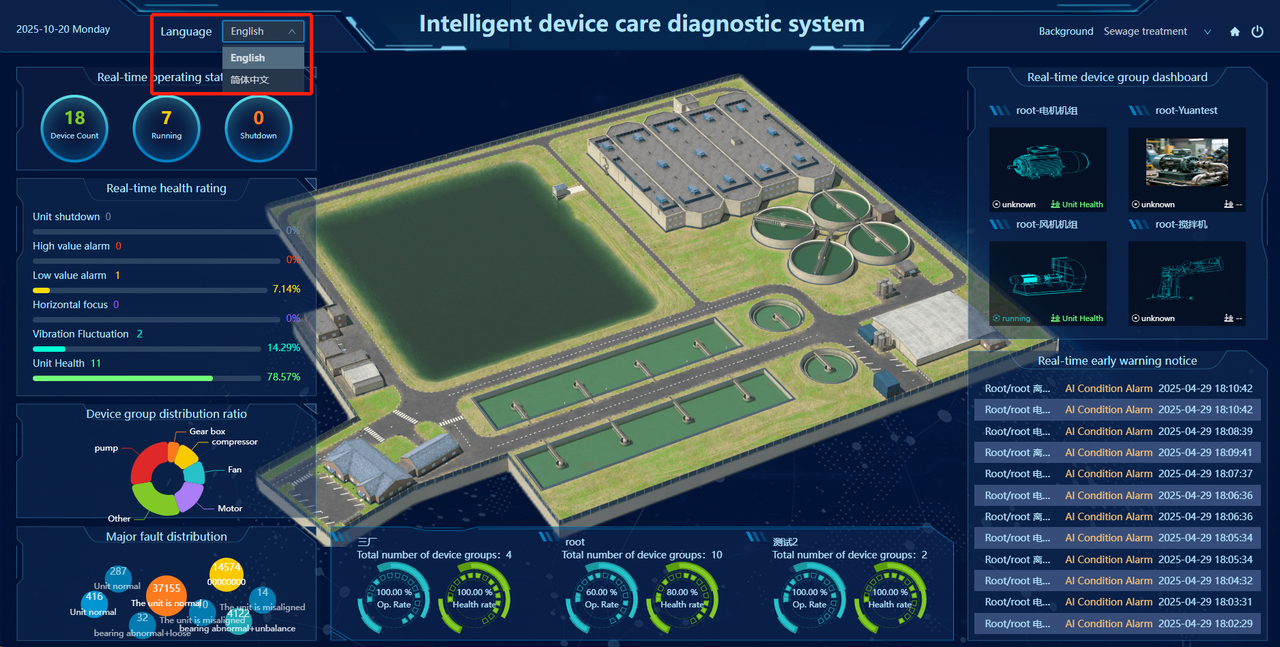
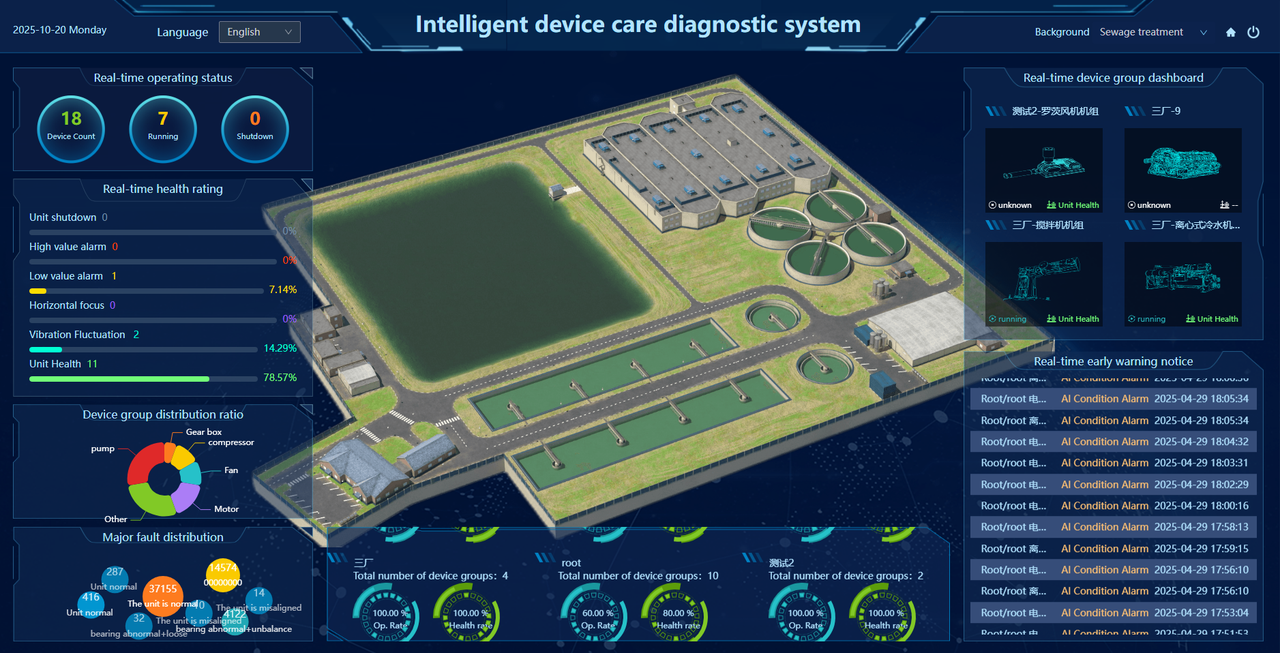
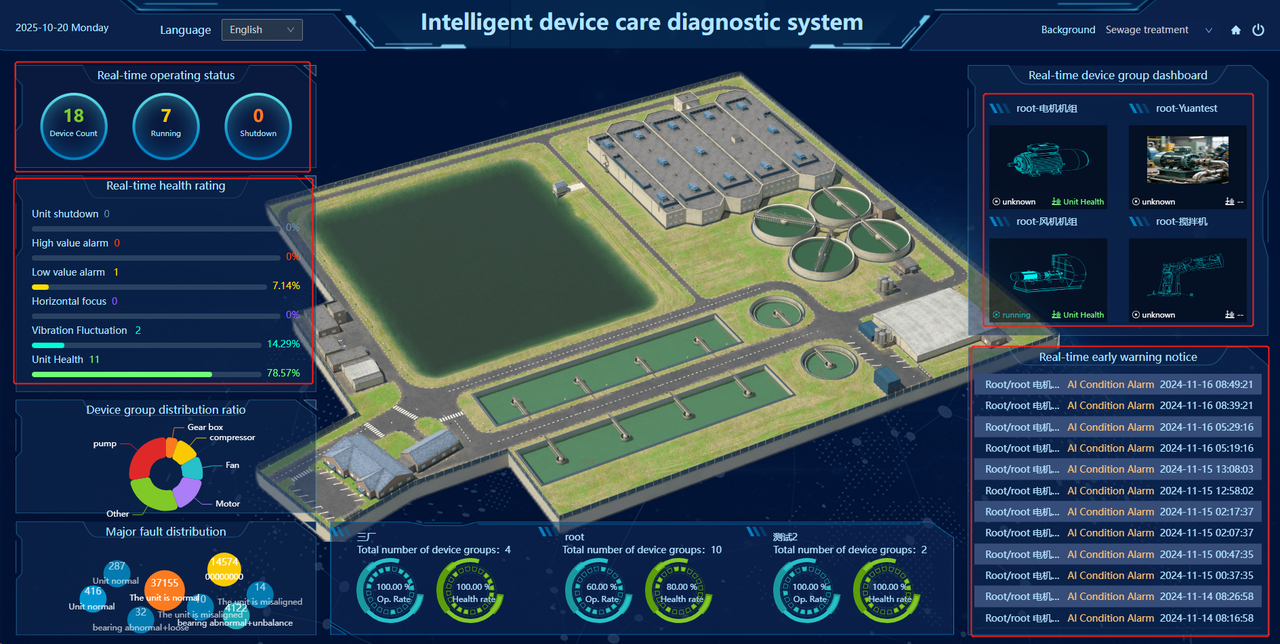
Intelligent Care Dashboard (Home Page)
1. Function Overview
Use the intelligent care dashboard to quickly access real-time operation status, real-time health grade, unit proportion distribution, main fault distribution, unit real-time kanban, real-time warning notifications, and real-time health statistics of organizational units:
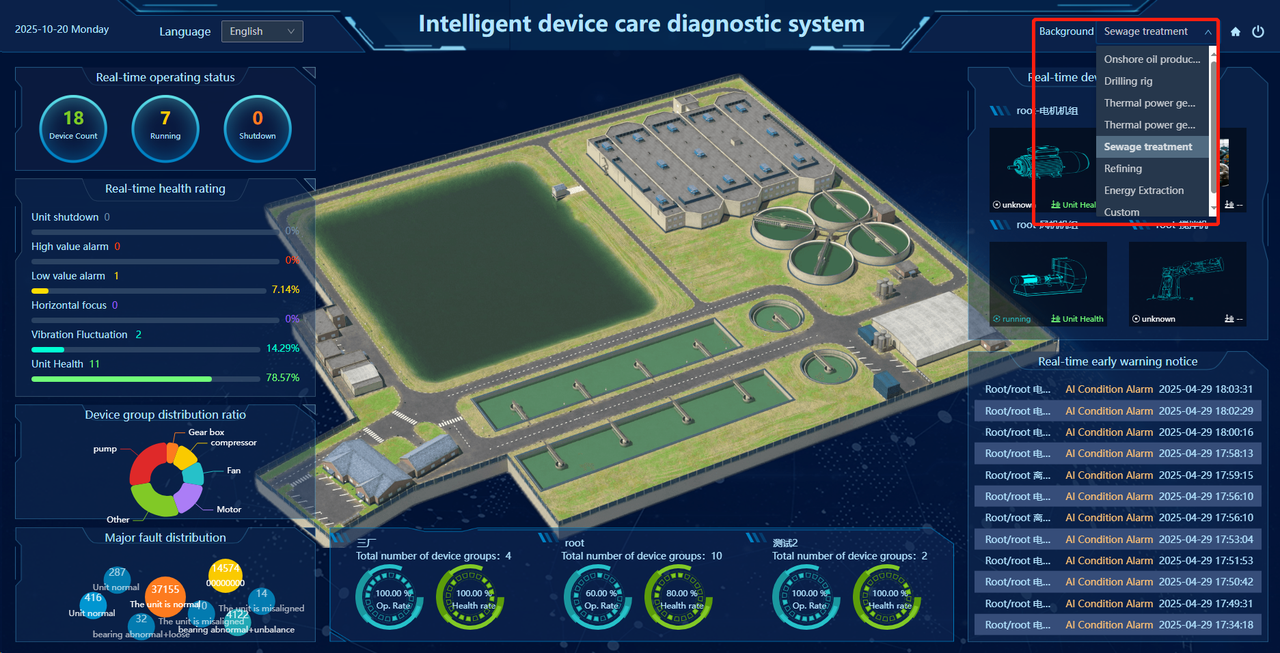
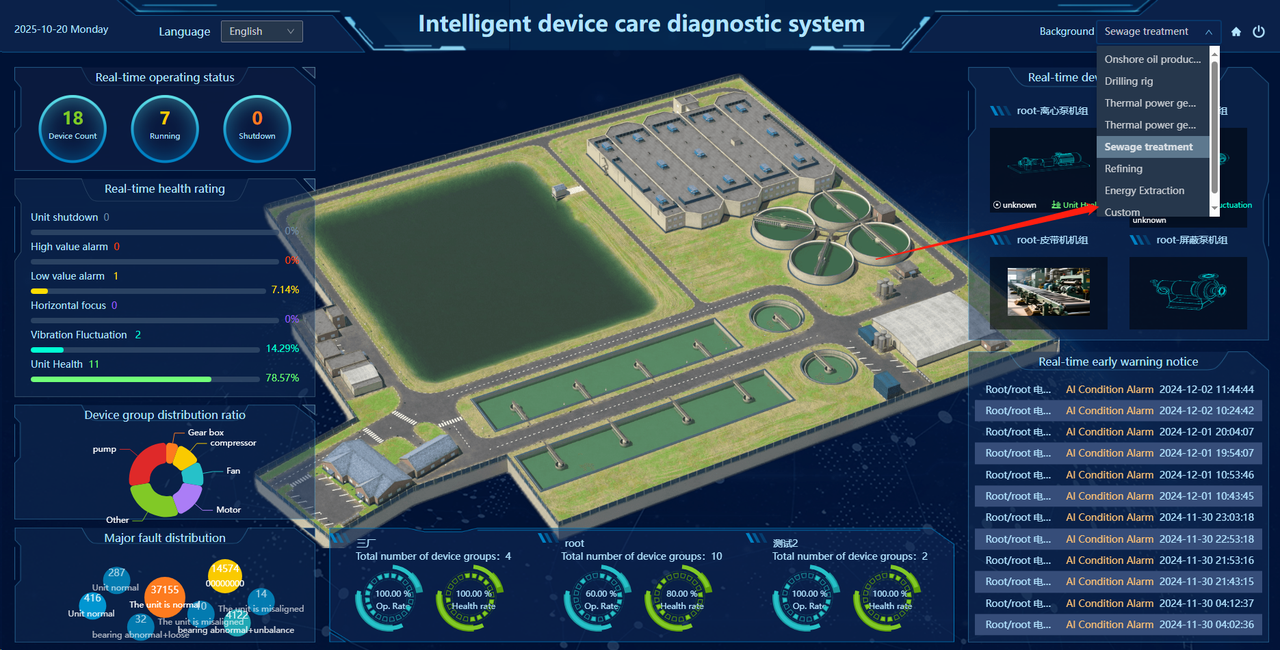
2. Background Selection
The intelligent care dashboard allows users to change the background image. Click the "∨" in the upper-right corner and select from the drop-down menu. The system defaults to background images for onshore oil extraction, drilling platforms, metallurgy, thermal power generation, sewage treatment, refining, and energy extraction, which can be selected according to display requirements. Once selected, the background will be applied to all users in the organization.
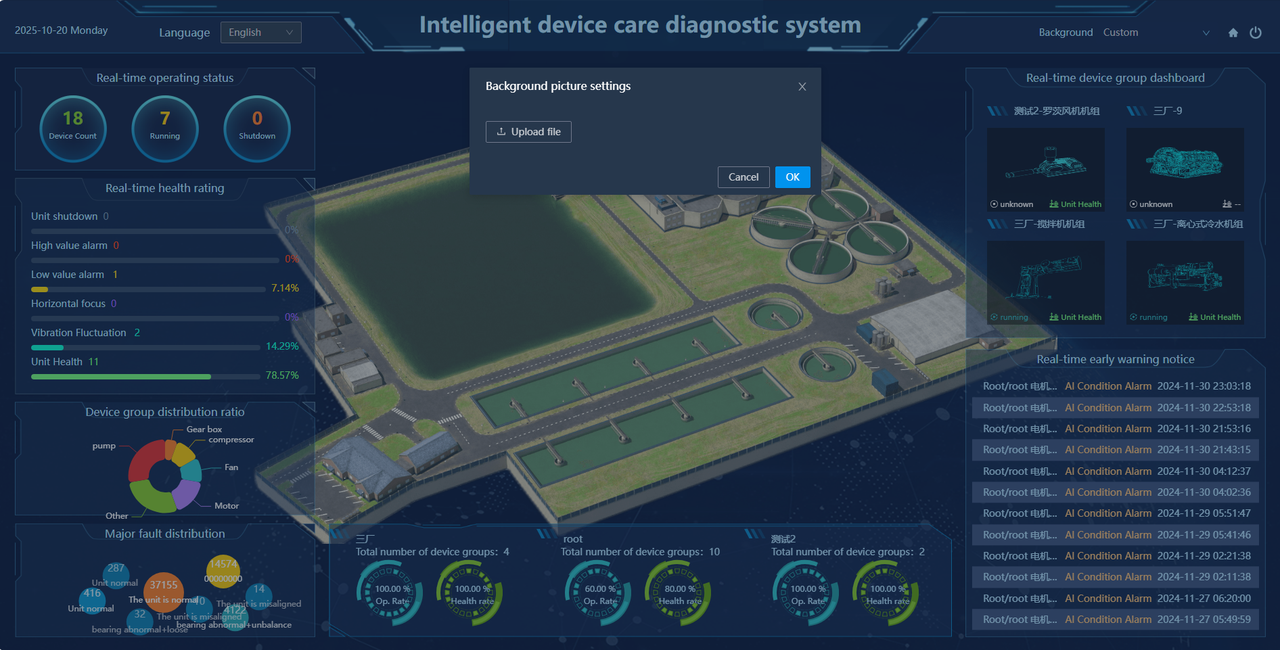
3. Background Upload
Users can also upload custom background images. Click the "∨" in the upper-right corner, select "Custom" below, and a pop-up window will appear for image upload. The image supports JPG/PNG format and must be under 10MB. After upload, all users in the organization will use this image as the dashboard background (file names cannot contain special characters).
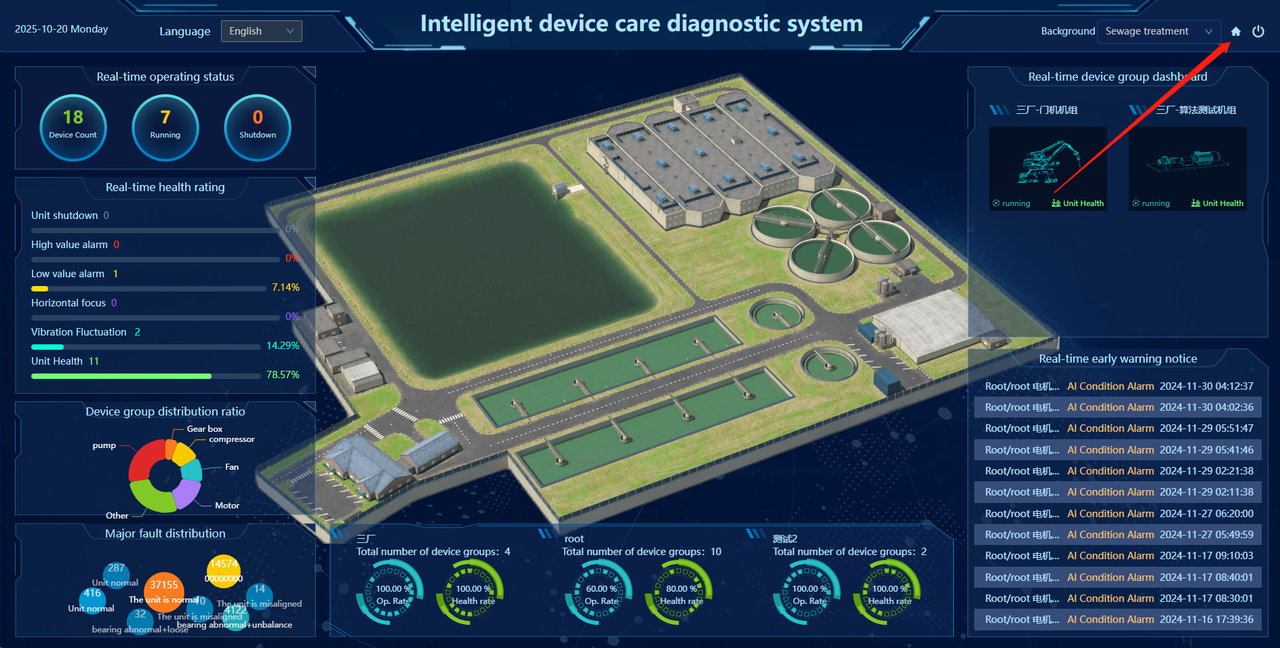
4. Unit Kanban
Click the "🏠" in the upper-right corner to enter the Unit Kanban interface, from which you can access other detail interfaces.
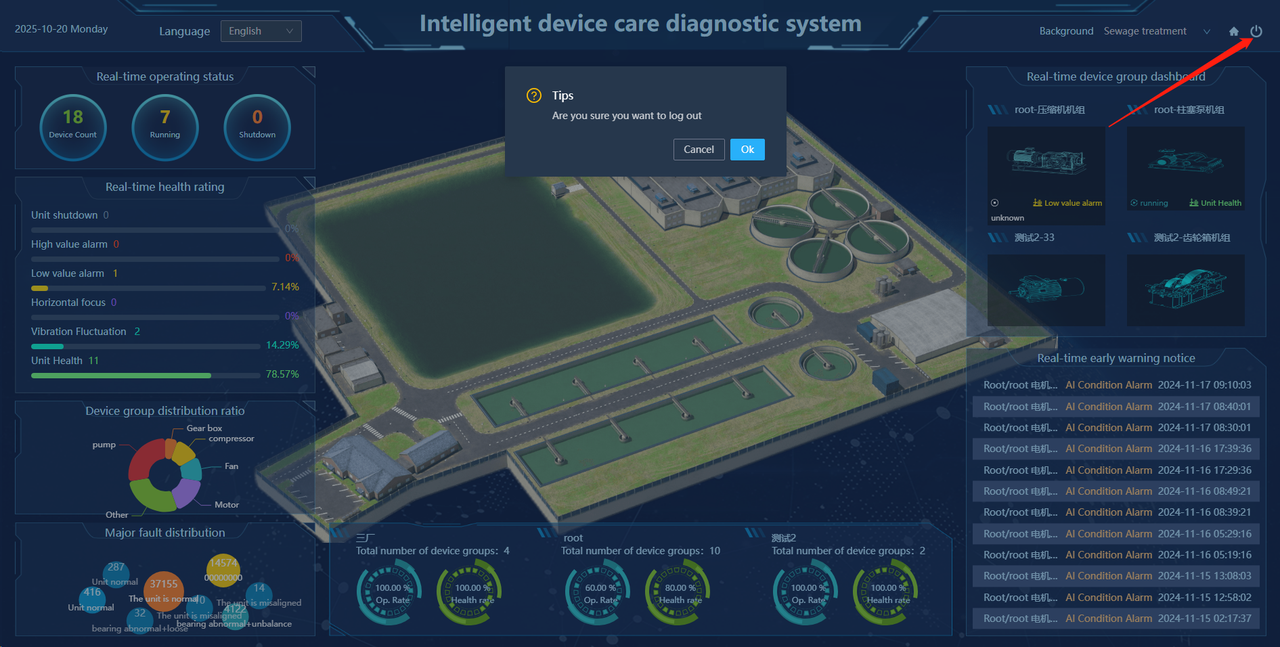
5. Logout
Click the "⏻" in the upper-right corner to log out.
6. Detail Jump
Click the following four sections to jump to the corresponding detail interfaces:
Intelligent Unit Care
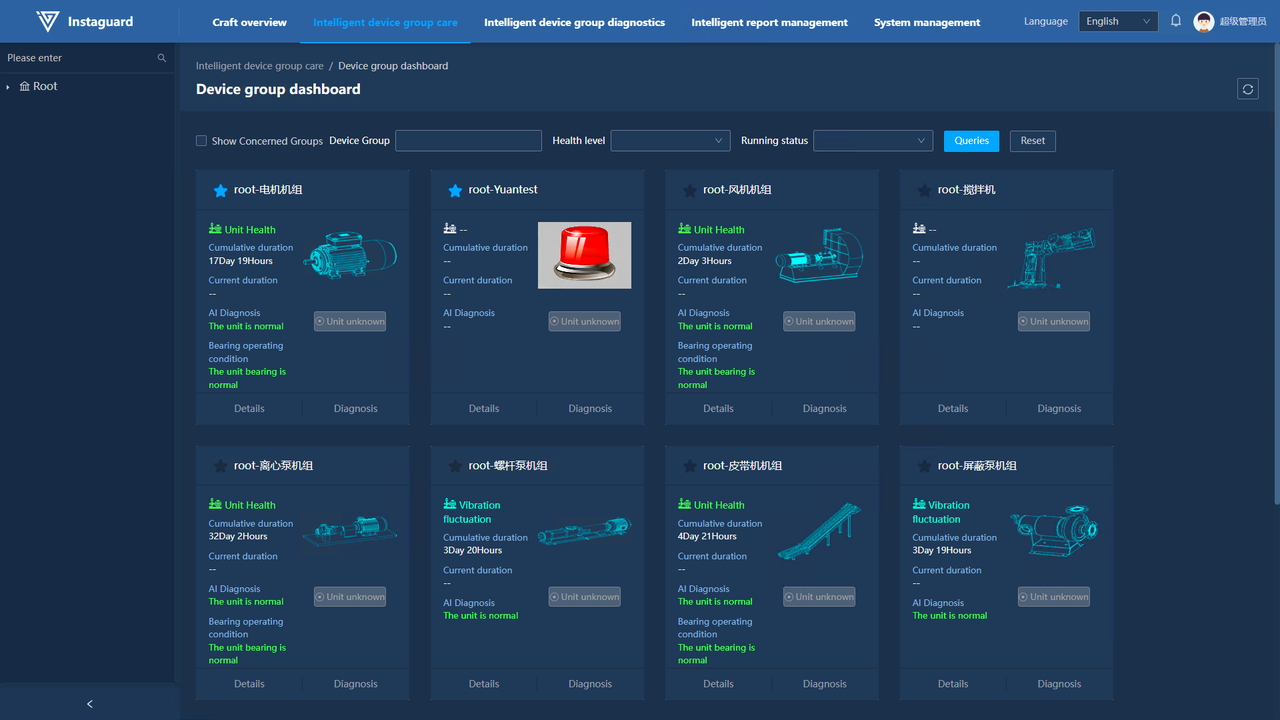
1. Unit Kanban
1.1 Function Overview
Use this function to centrally care for supervised units. The kanban displays the unit's organization, name, structure, current health grade, accumulated operation time, current operation time, and real-time status. The AI version supports viewing the latest AI care diagnosis results. Kanban supports the functions of changing unit overview diagrams according to unit subtypes, refreshing the database, refreshing the existing unit overview diagrams according to unit subtypes, defaulting to the most recently created image from the subtype library, and quickly screening by unit name, health level, and running status.
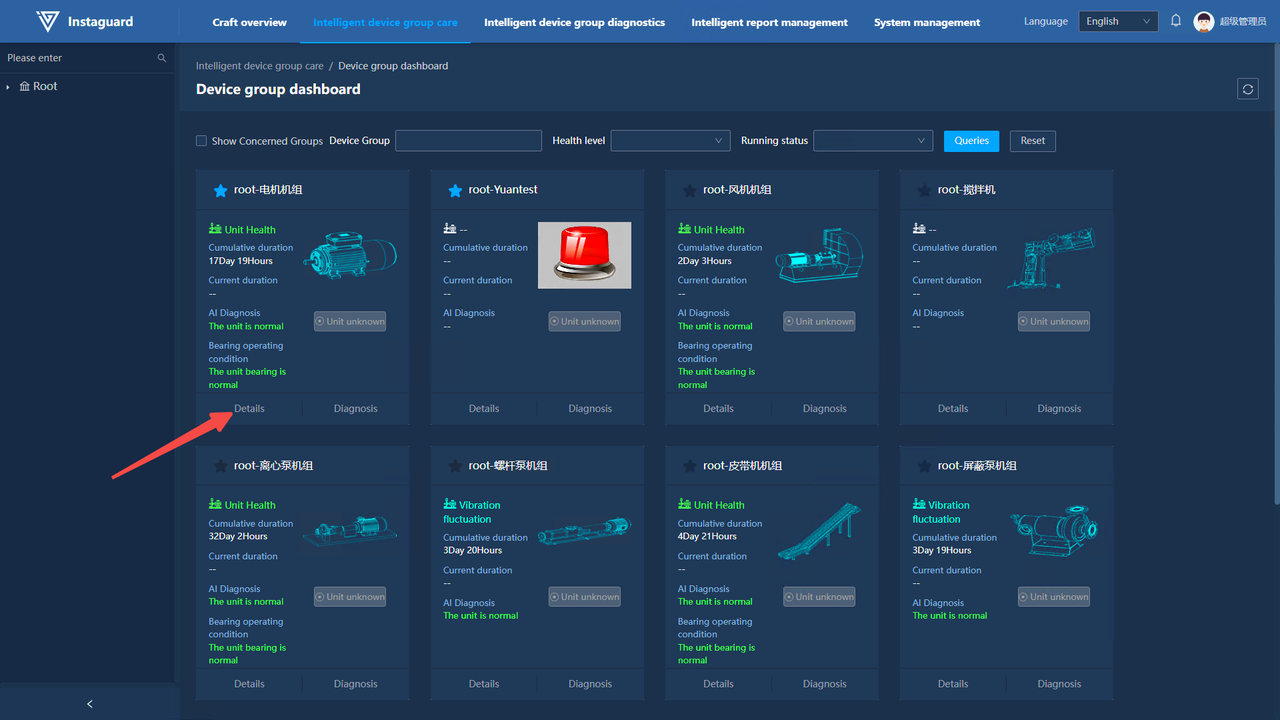
2. Unit Details
2.1 Navigation Path
「Intelligent Unit Care」 → 「Unit Kanban」 → 「Details」
2.2 Function Overview
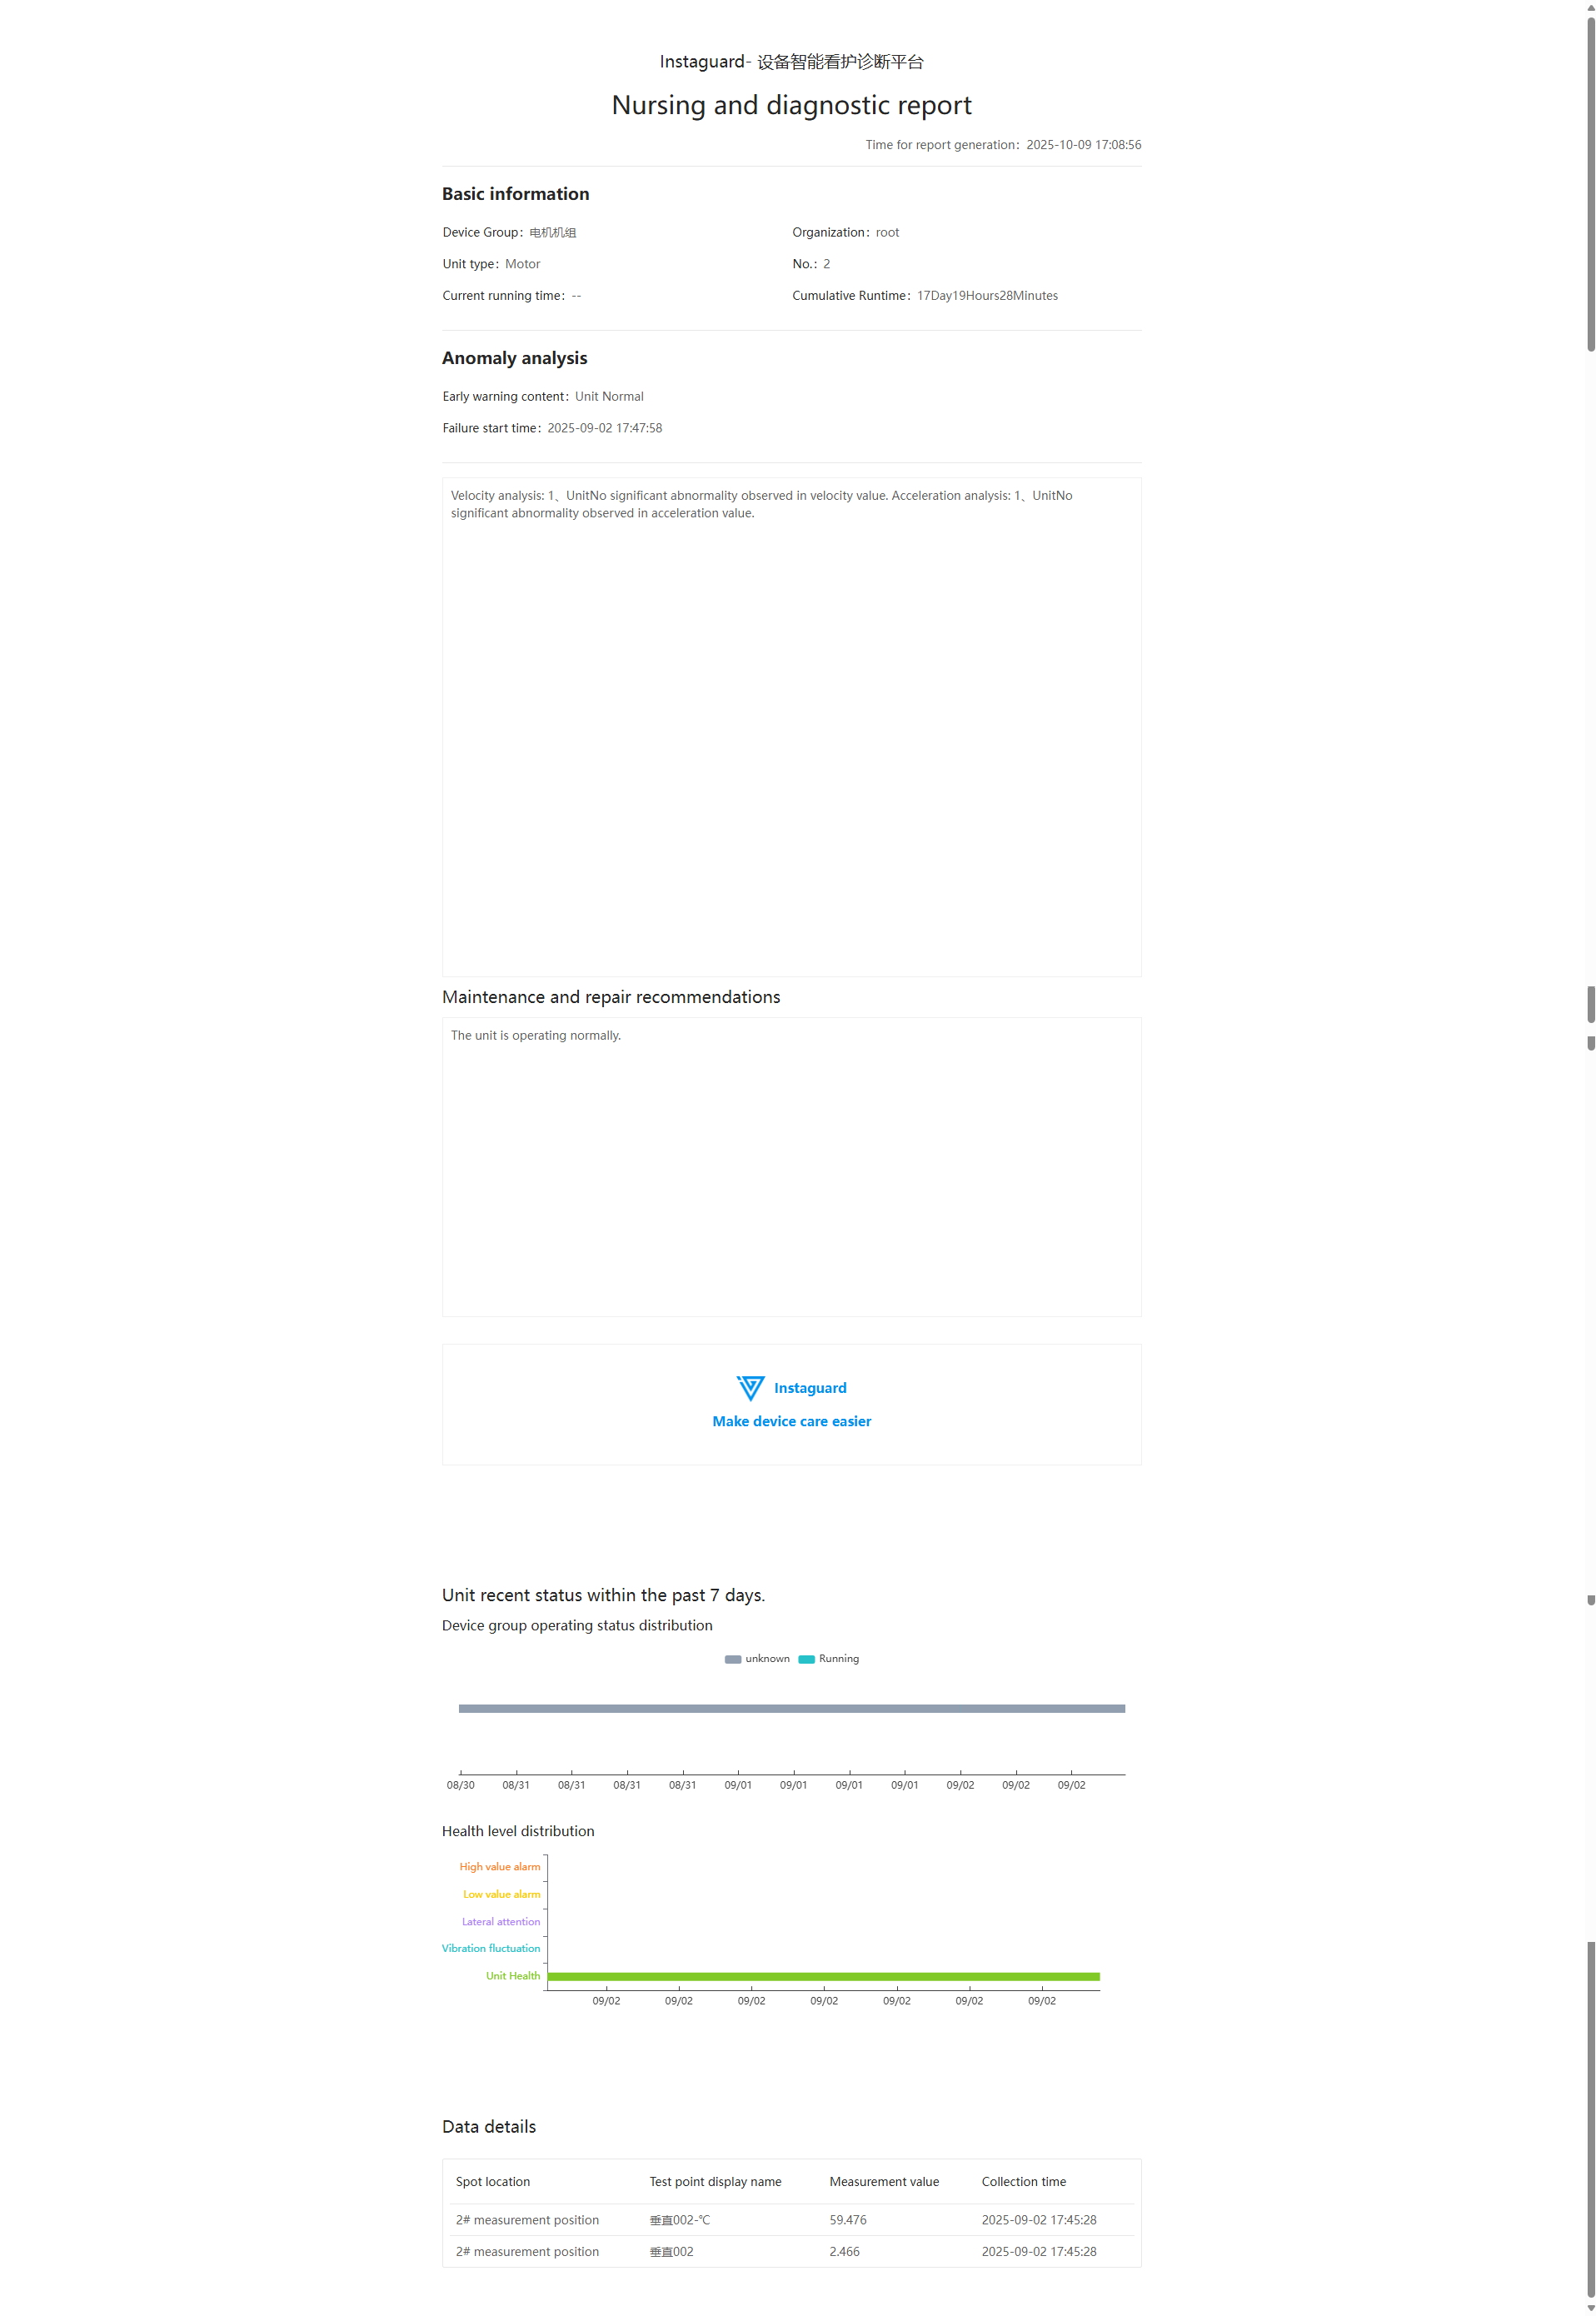
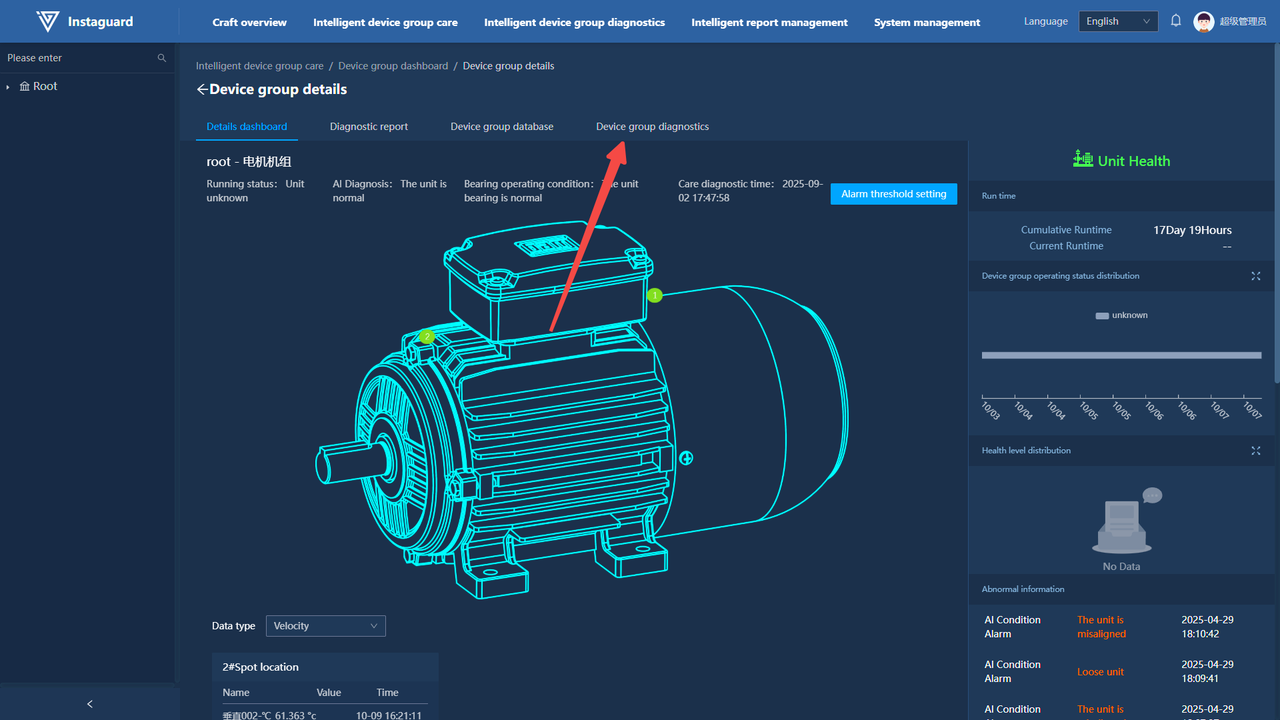
Unit details enable comprehensive care and diagnosis of specified units. The detail kanban shows the unit structure, installation positions of measuring points, real-time operation status, and (for AI version) the latest AI diagnosis results. It also displays real-time data from installed IOT hardware, highlights data exceeding set thresholds, and shows recent/specified-period operation status distribution, health grade distribution, and the latest abnormal alarms.
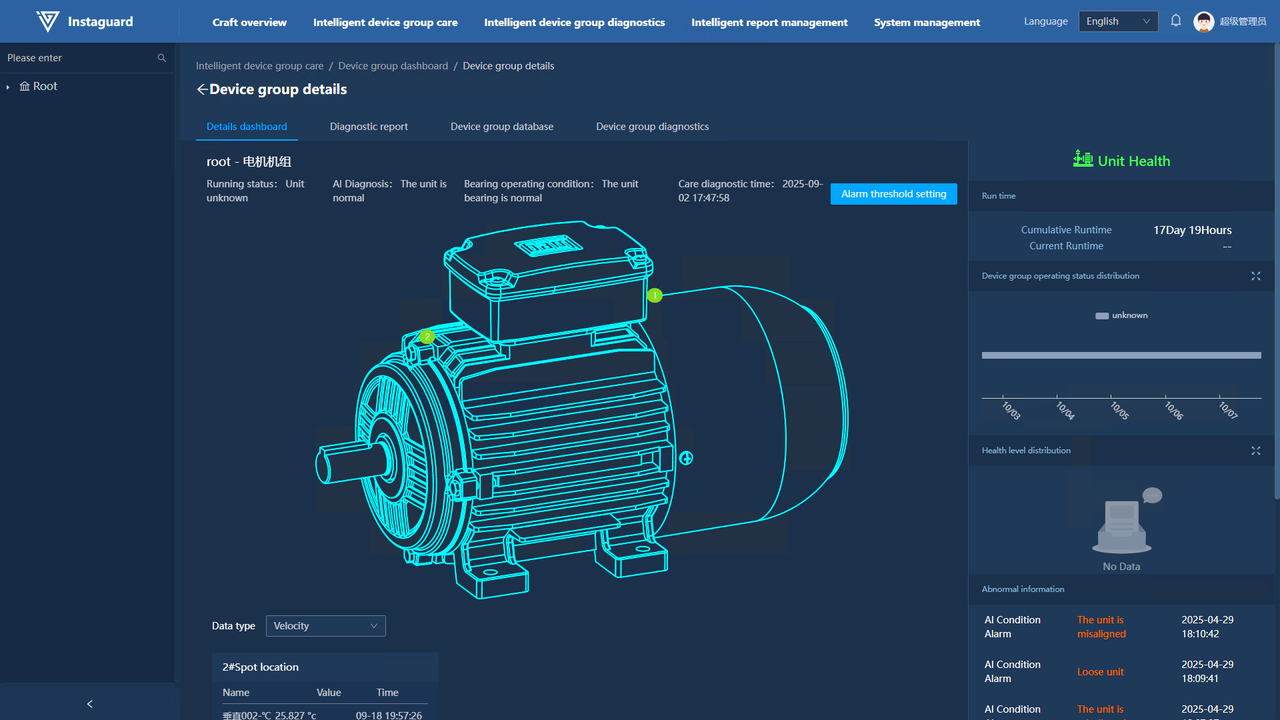
2.3 Detail Kanban
2.3.1 Viewing Unit Real-time Data
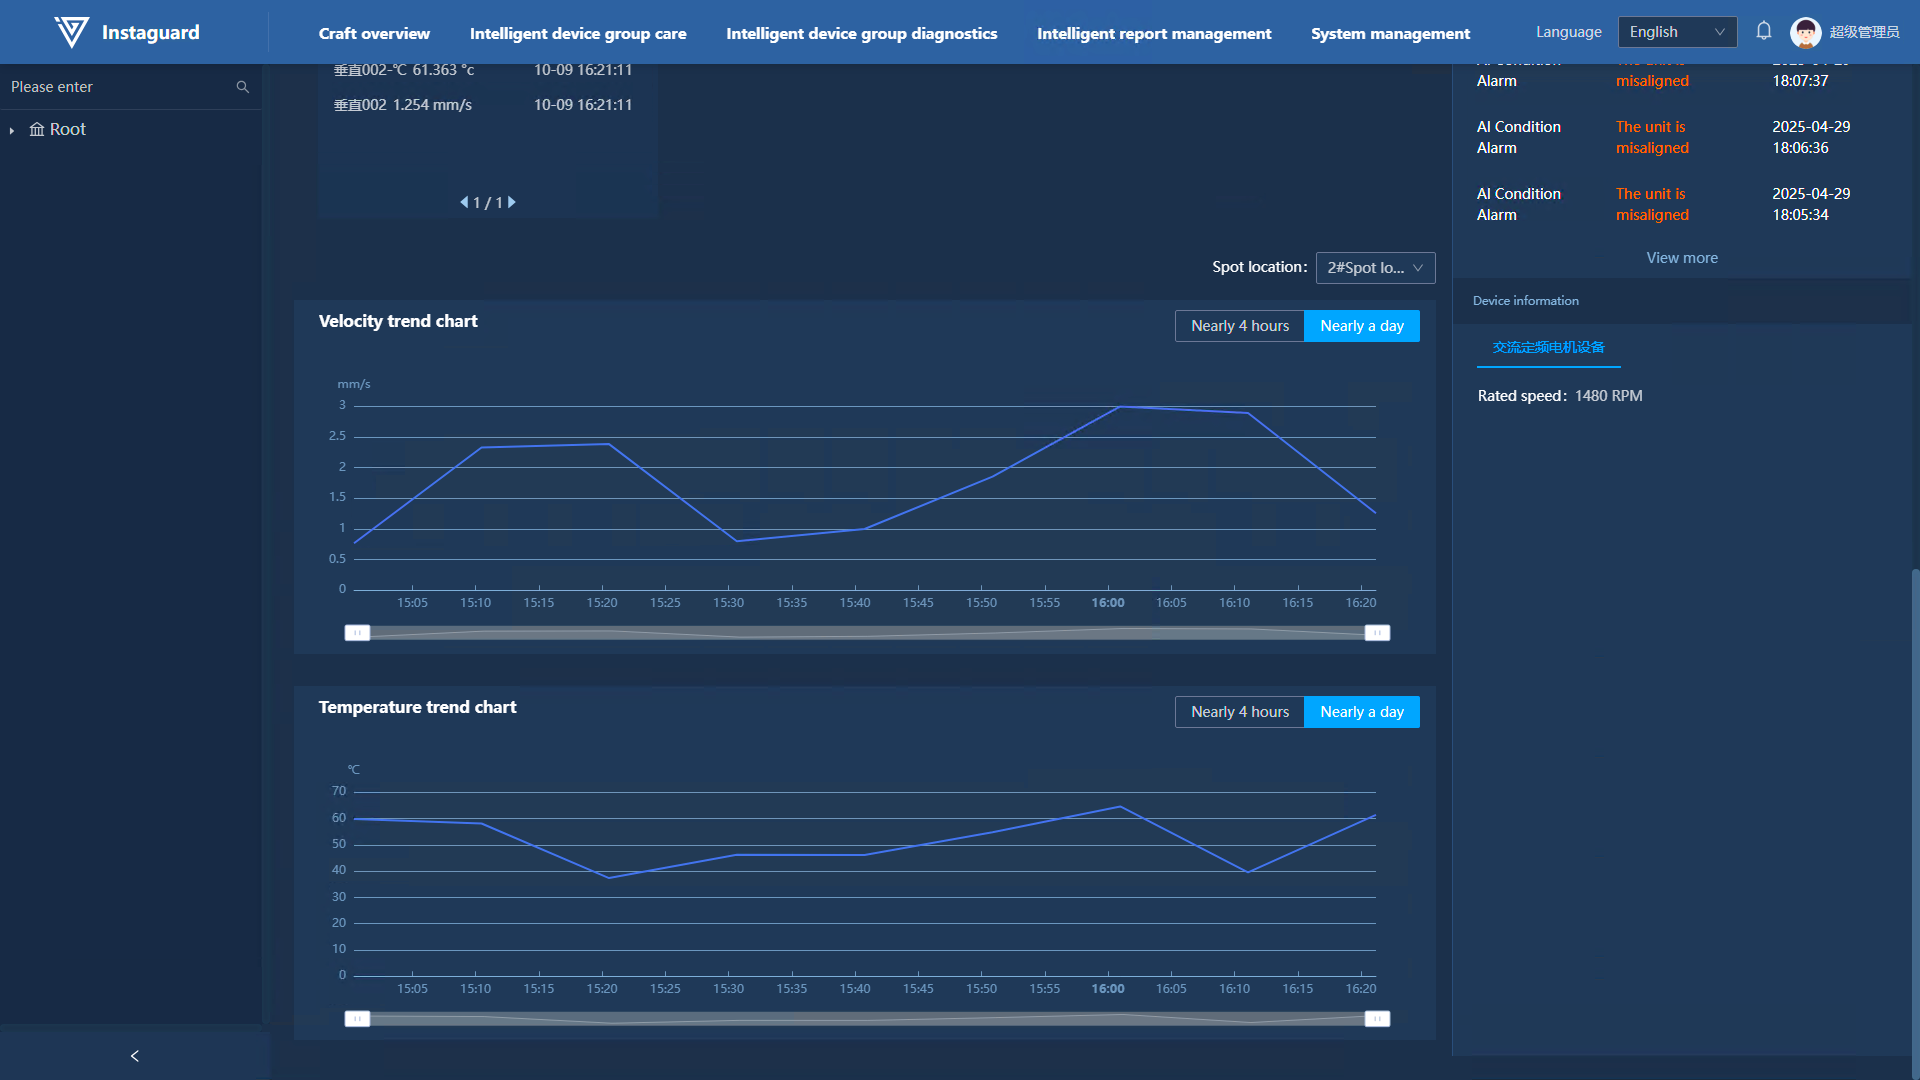
After entering unit details, the latest characteristic data of the cared unit are displayed below the kanban, arranged by measuring point positions. Vibration data in each measuring point kanban are ordered by temperature, Z-axis, X-axis, and Y-axis data. Data can be switched by type (acceleration/velocity).
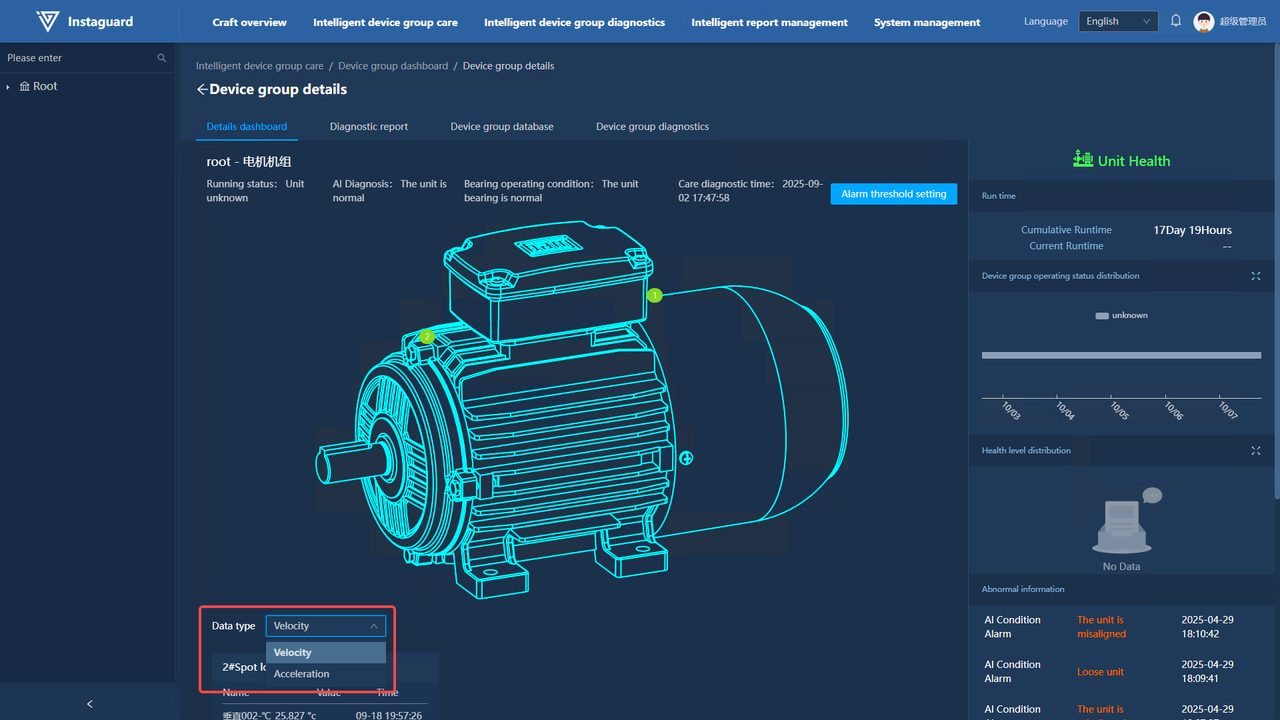
-
Each kanban page displays 4 pieces of data; use " < " " > " to page through.
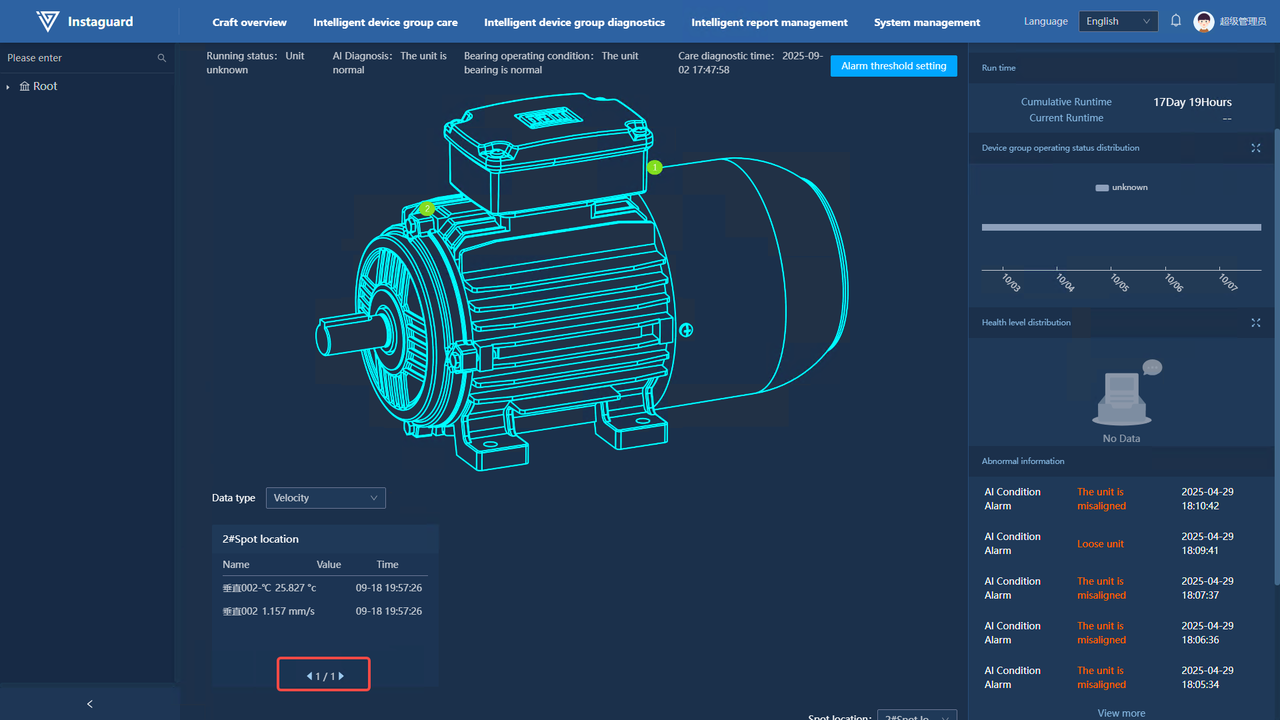
-
A corresponding trend chart is displayed below, supporting zooming and hover-to-view details. Select measuring points to switch.
2.3.2 Viewing Real-time Operation Status
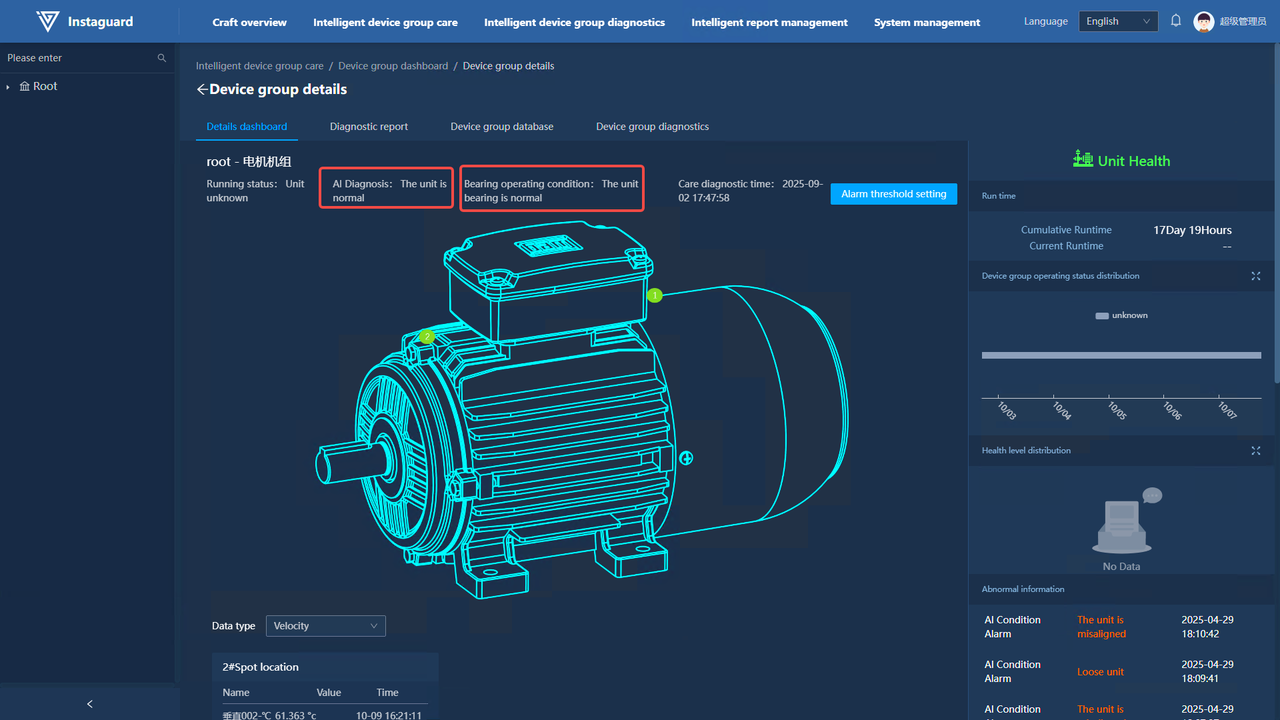
In the middle area of the details, the unit structure and real-time operation status, along with the latest AI diagnosis conclusion, are displayed.

2.3.3 Viewing Care Diagnosis Reports
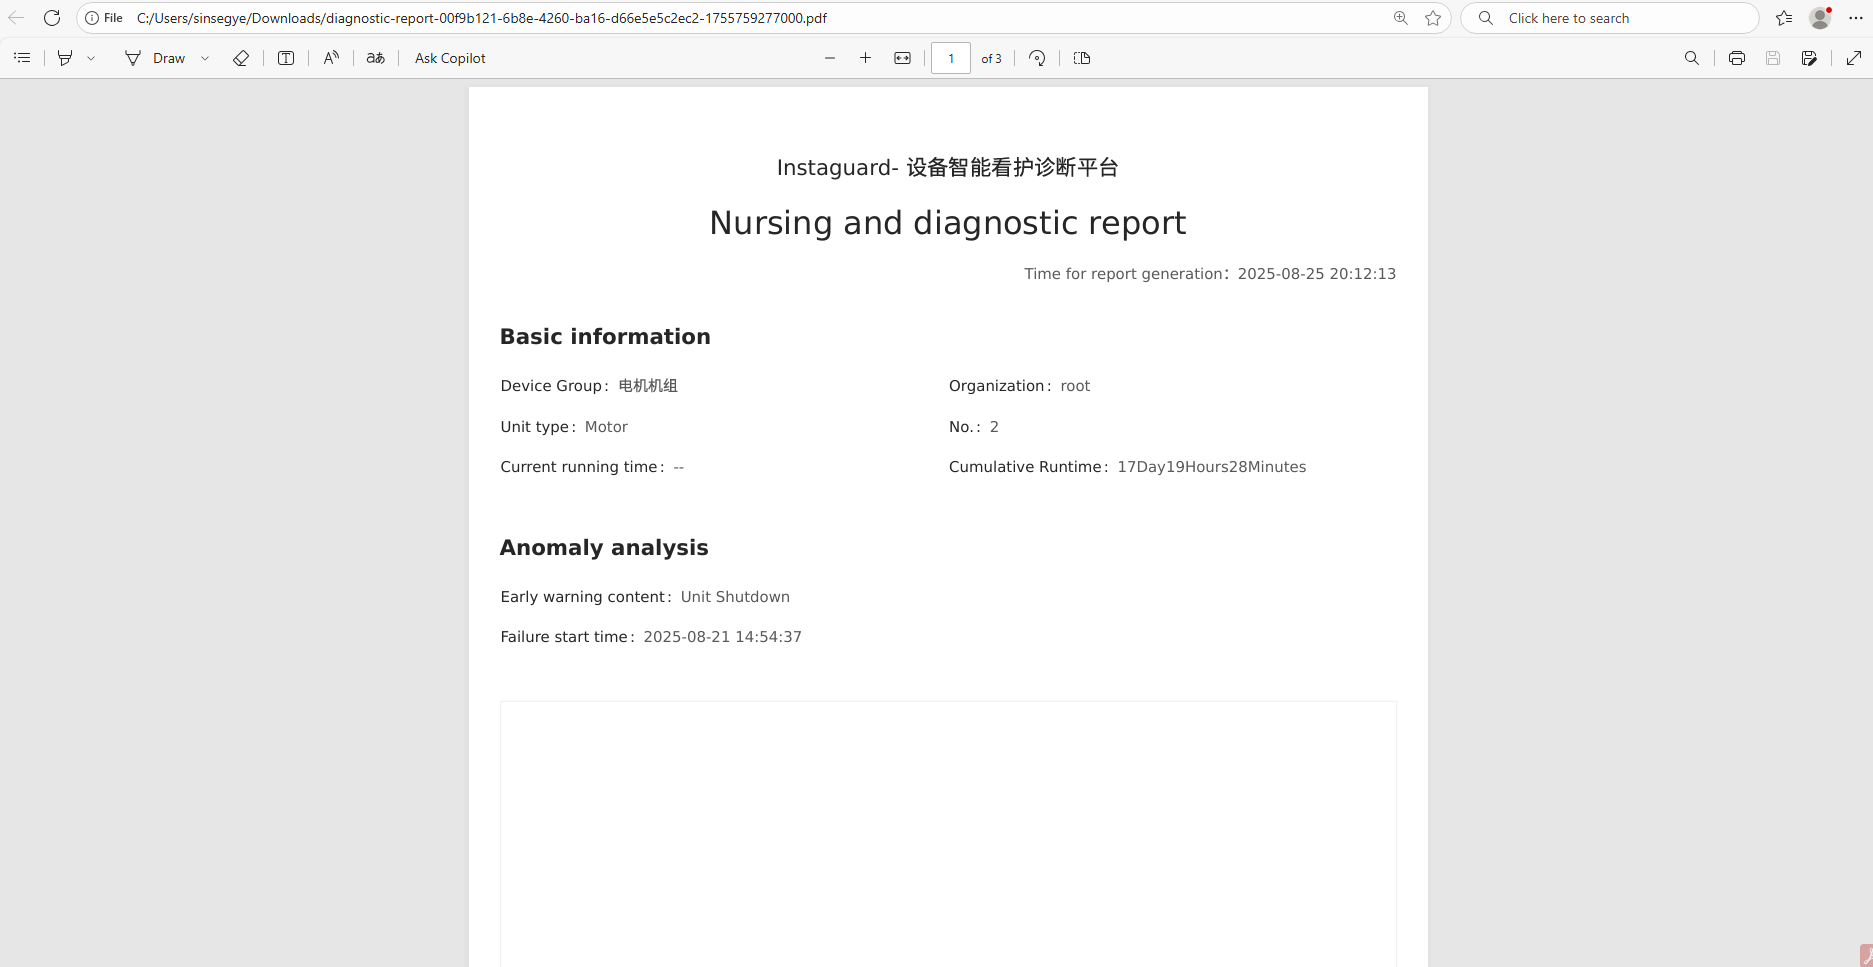
Click "Unit AI Condition" or "Bearing Condition" to automatically generate and download the diagnosis report as a PDF.
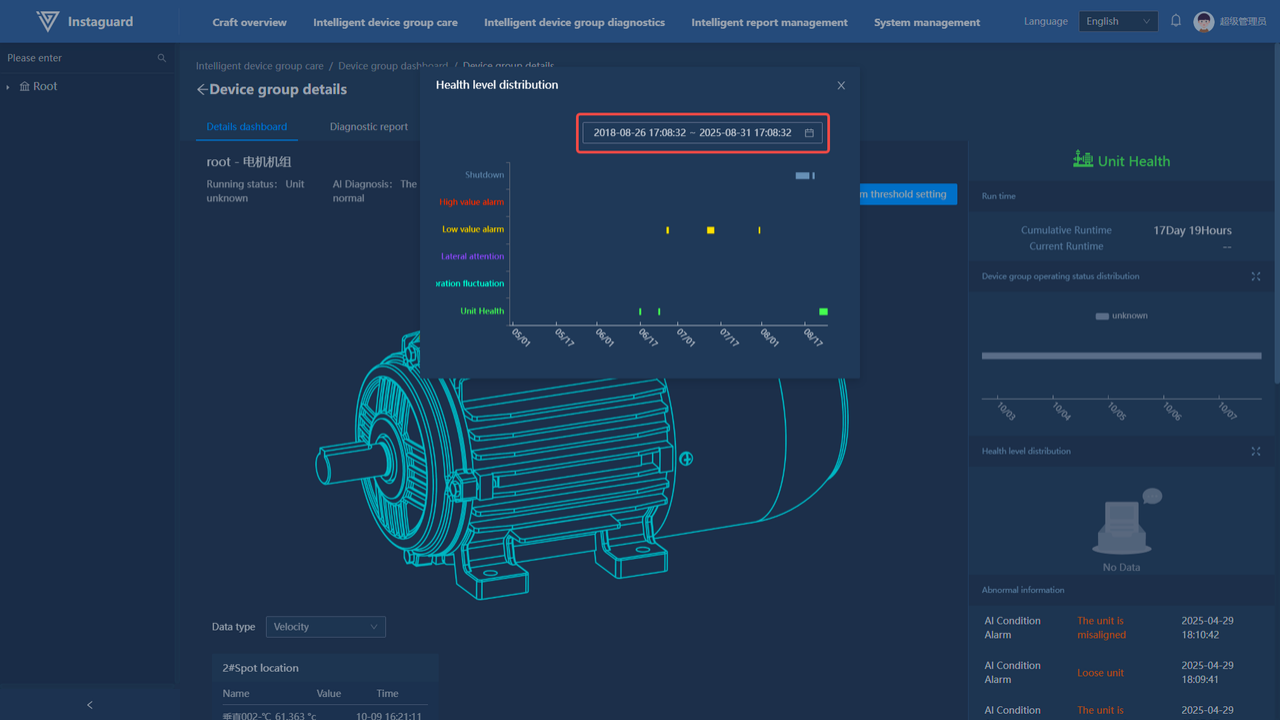
2.3.4 Viewing Health Grade History
After entering the unit kanban, click "Health Grade Distribution" to access the history page.
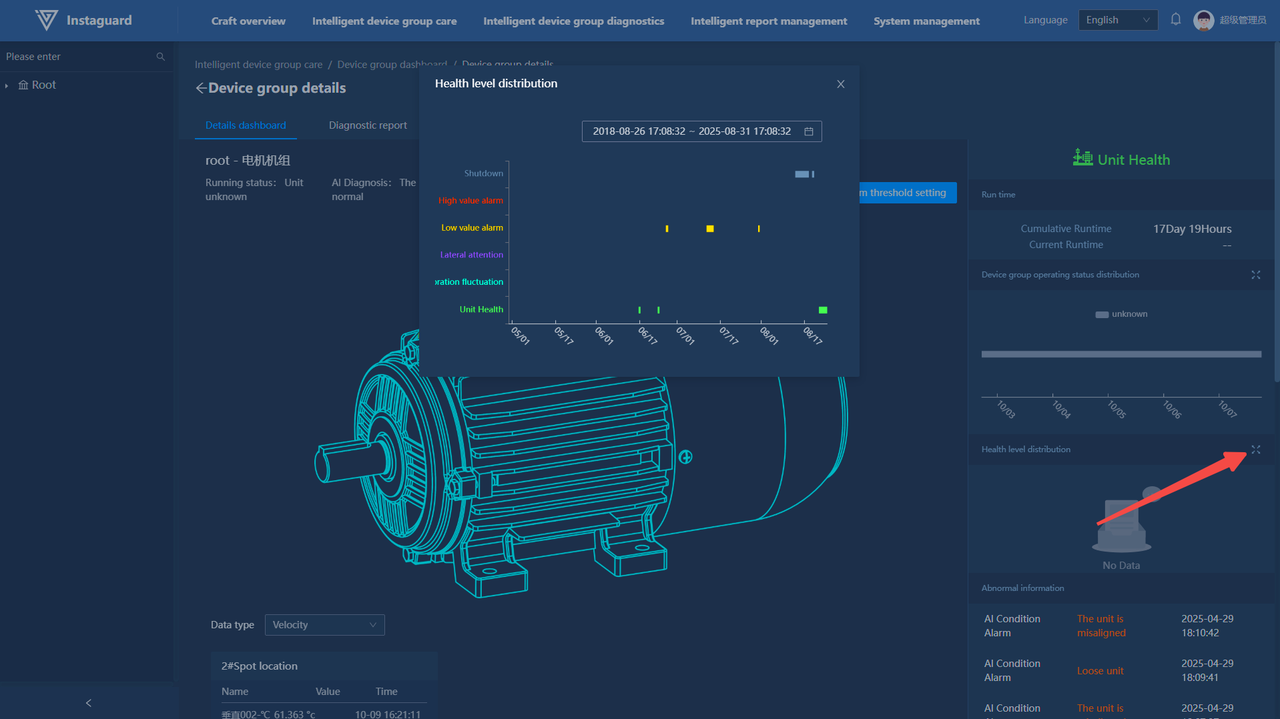
- Select a specified date ,the start time and end time on the horizontal axis are displayed according to the selected date range,to display the health grade distribution for that period.
2.3.5 Viewing Operation History Status
After entering the unit kanban, click "Unit Operation Status Distribution" to access the history page.
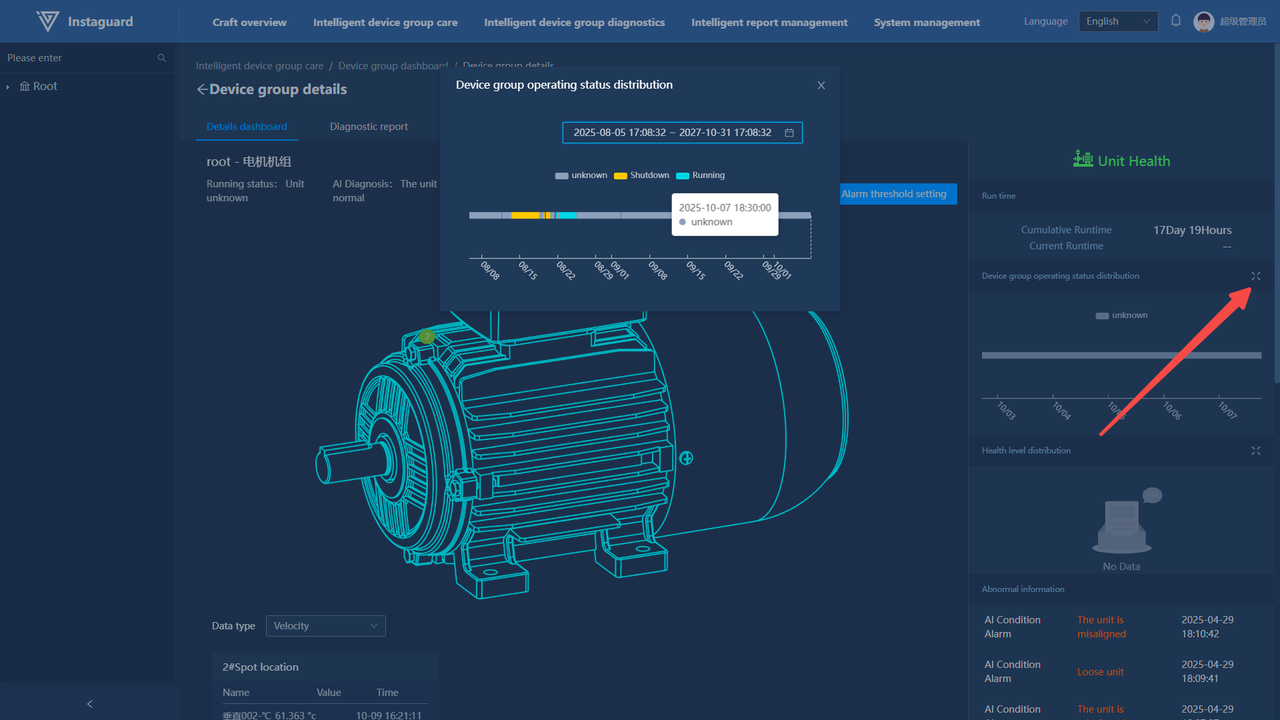
- Select a specified date,the start time and end time on the horizontal axis are displayed according to the selected date range, to display the operation status distribution for that period, or click the legend to filter displayed information.
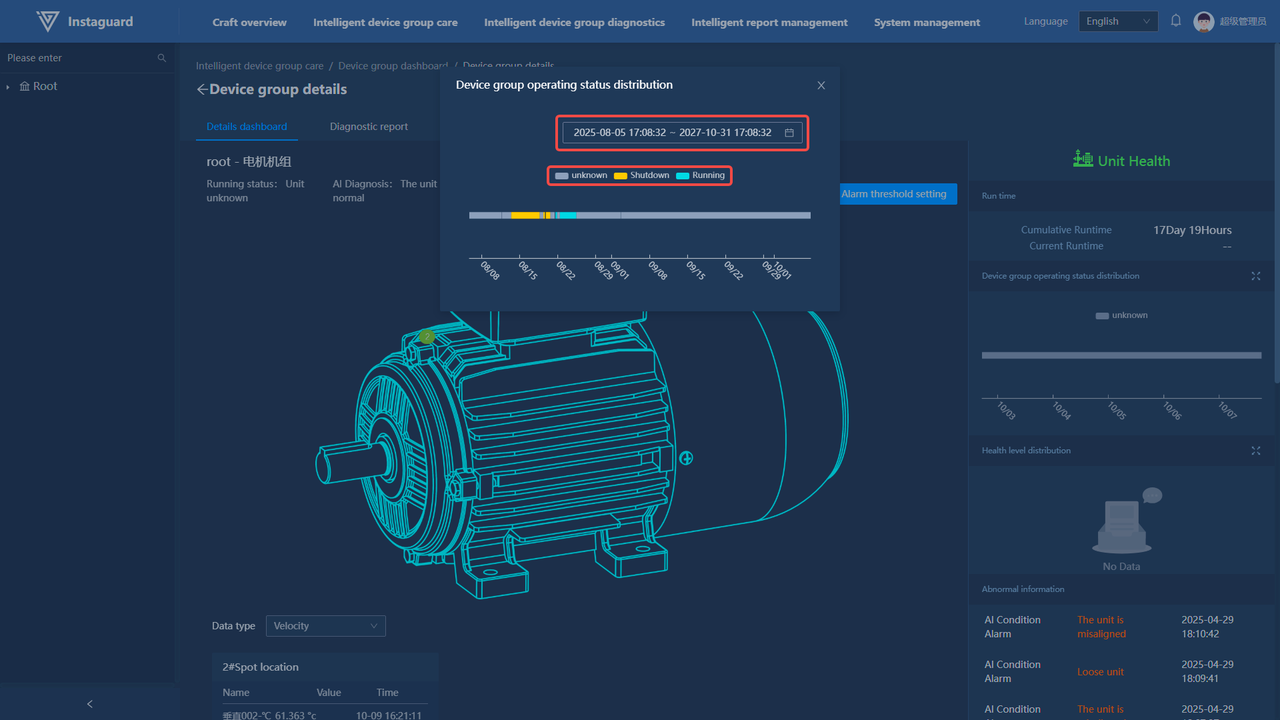
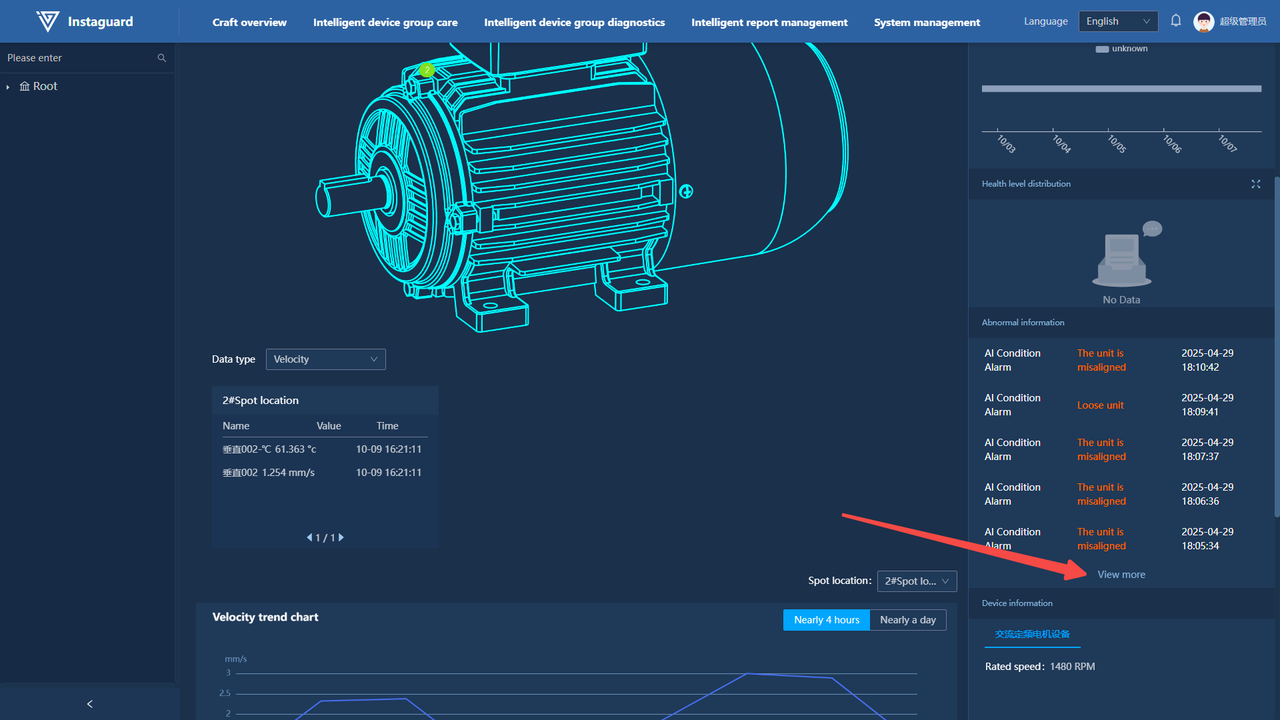
2.3.6 Recent Abnormality Information
In the lower-right "Abnormality Information" section, view the latest 5 abnormalities (type, status, time). Click "View More" to jump to the Abnormality Management function page.
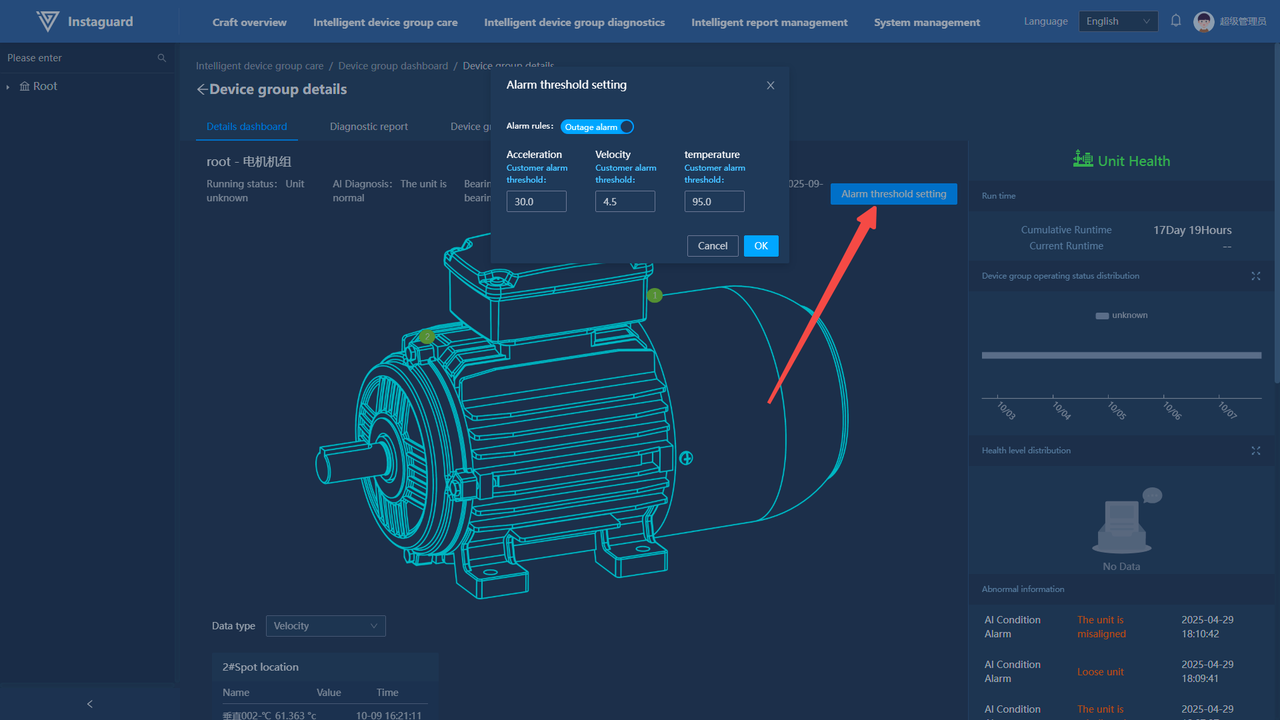
2.3.7 Alarm Threshold Setting
Click "Alarm Threshold Setting" to set thresholds in the pop-up window. The system will alarm when parameters exceed these thresholds. Click "OK" to save or "Cancel" to discard changes.
2.4 Diagnosis Reports
2.4.1 Viewing Diagnosis Reports
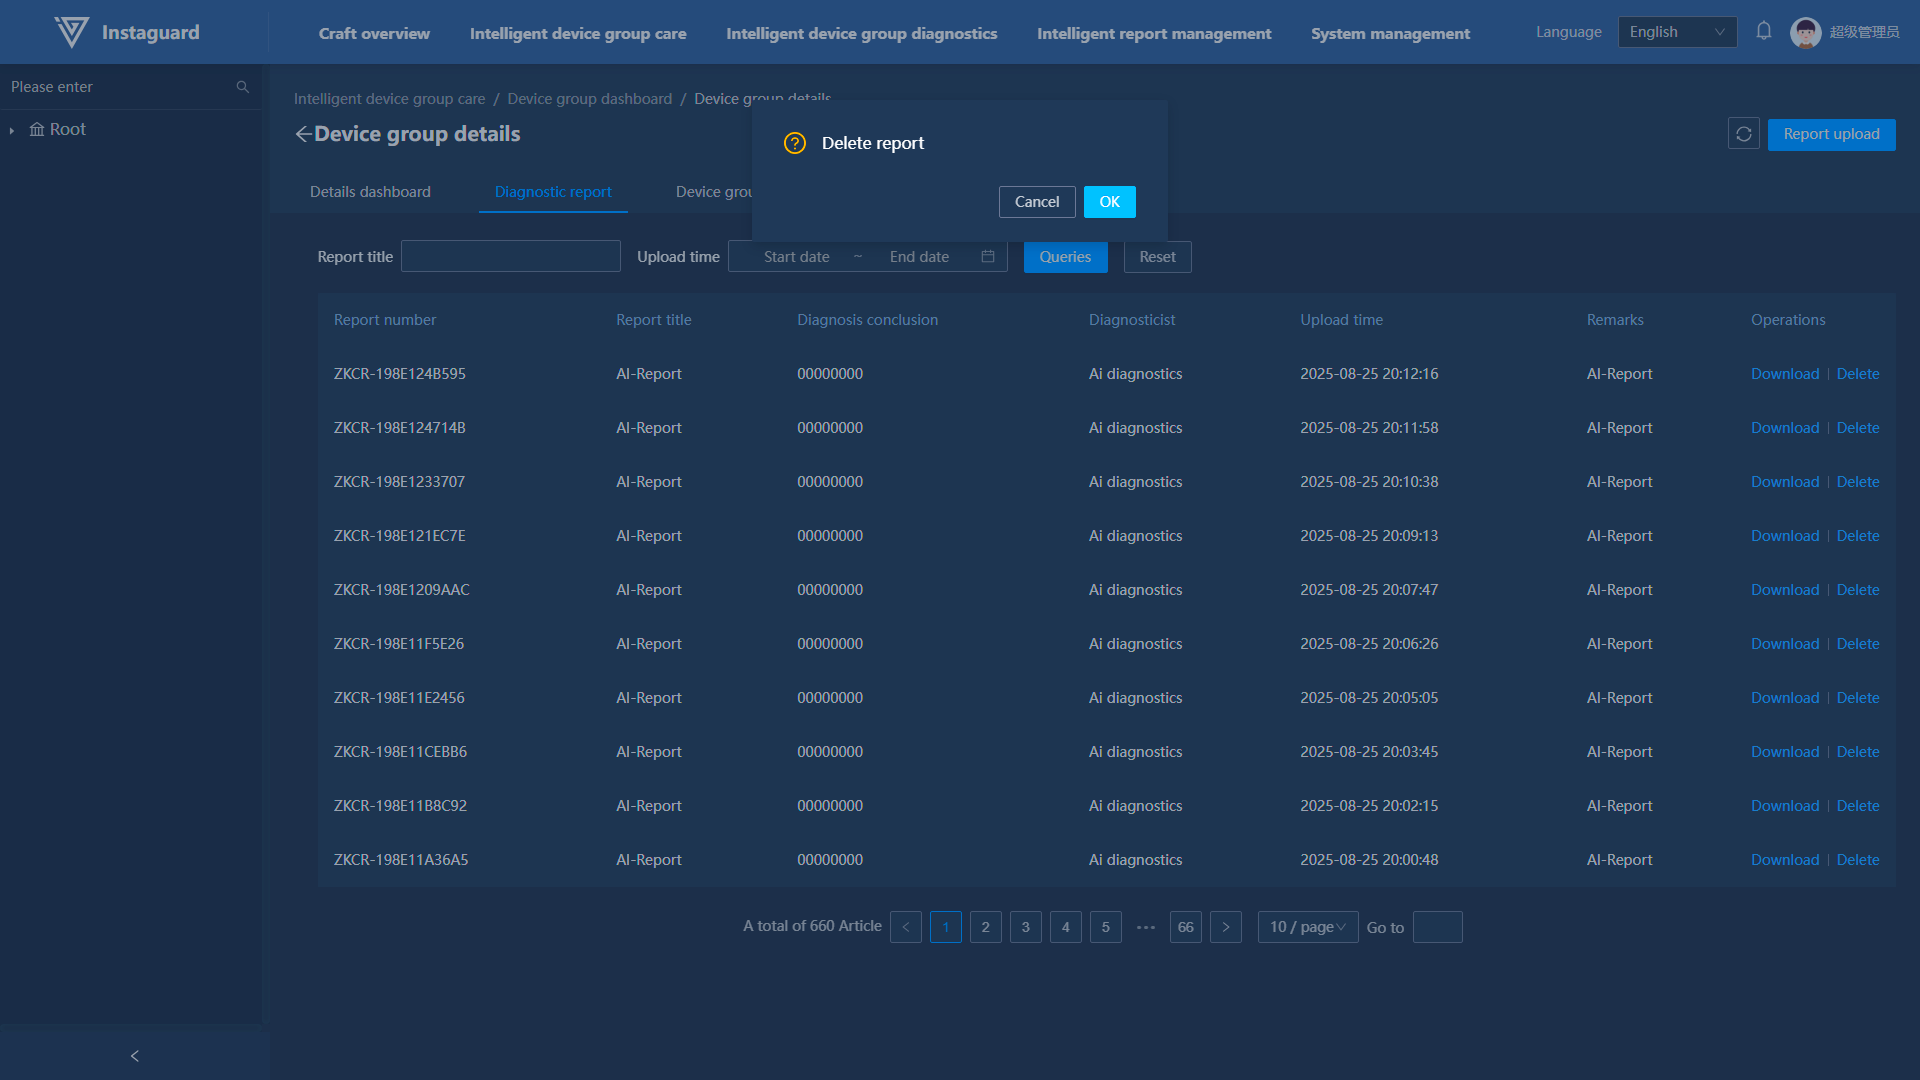
After entering unit details, click "Diagnosis Report" to jump to the report page, where manually uploaded reports and quick diagnosis conclusions are displayed.
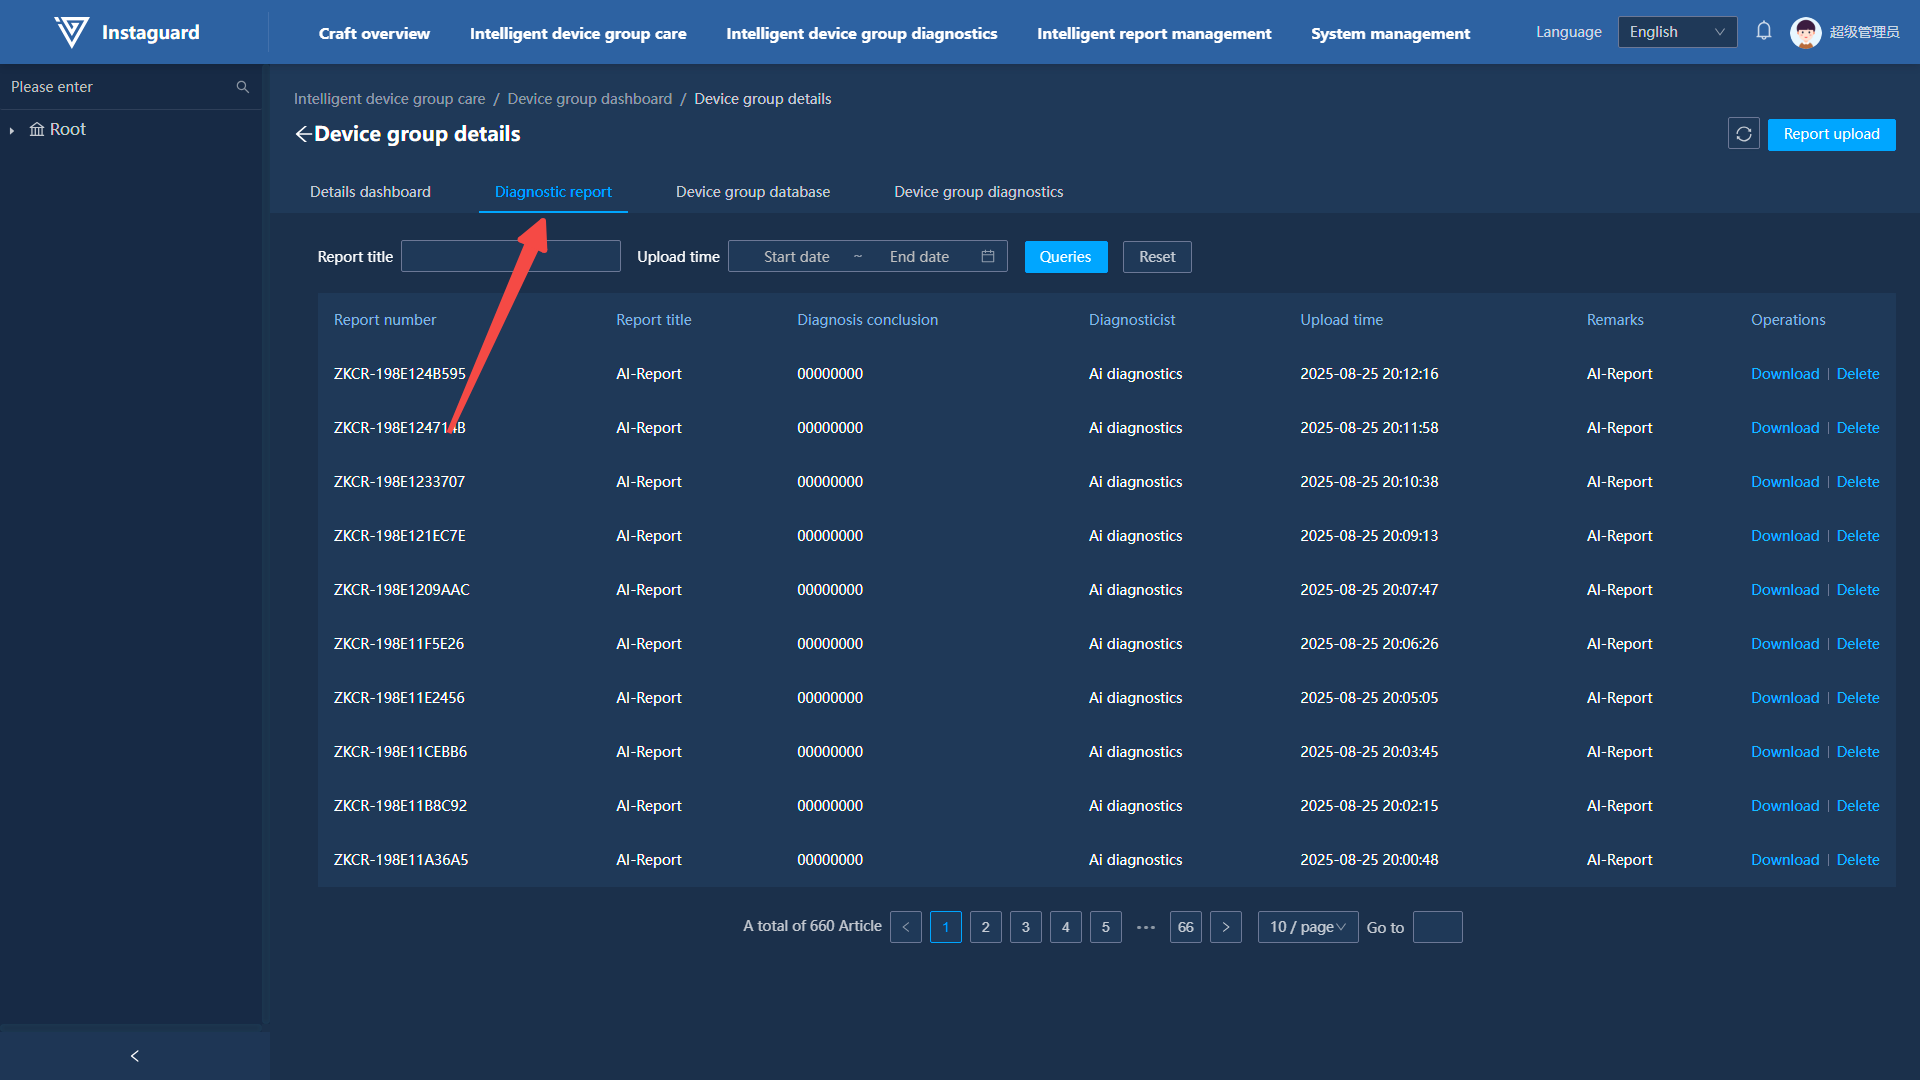
- Click "Download" for a specified entry to save the report locally; click "Delete" to remove it.
2.4.2 Uploading Diagnosis Reports
On the diagnosis report page, click "Report Upload" to open the upload interface.
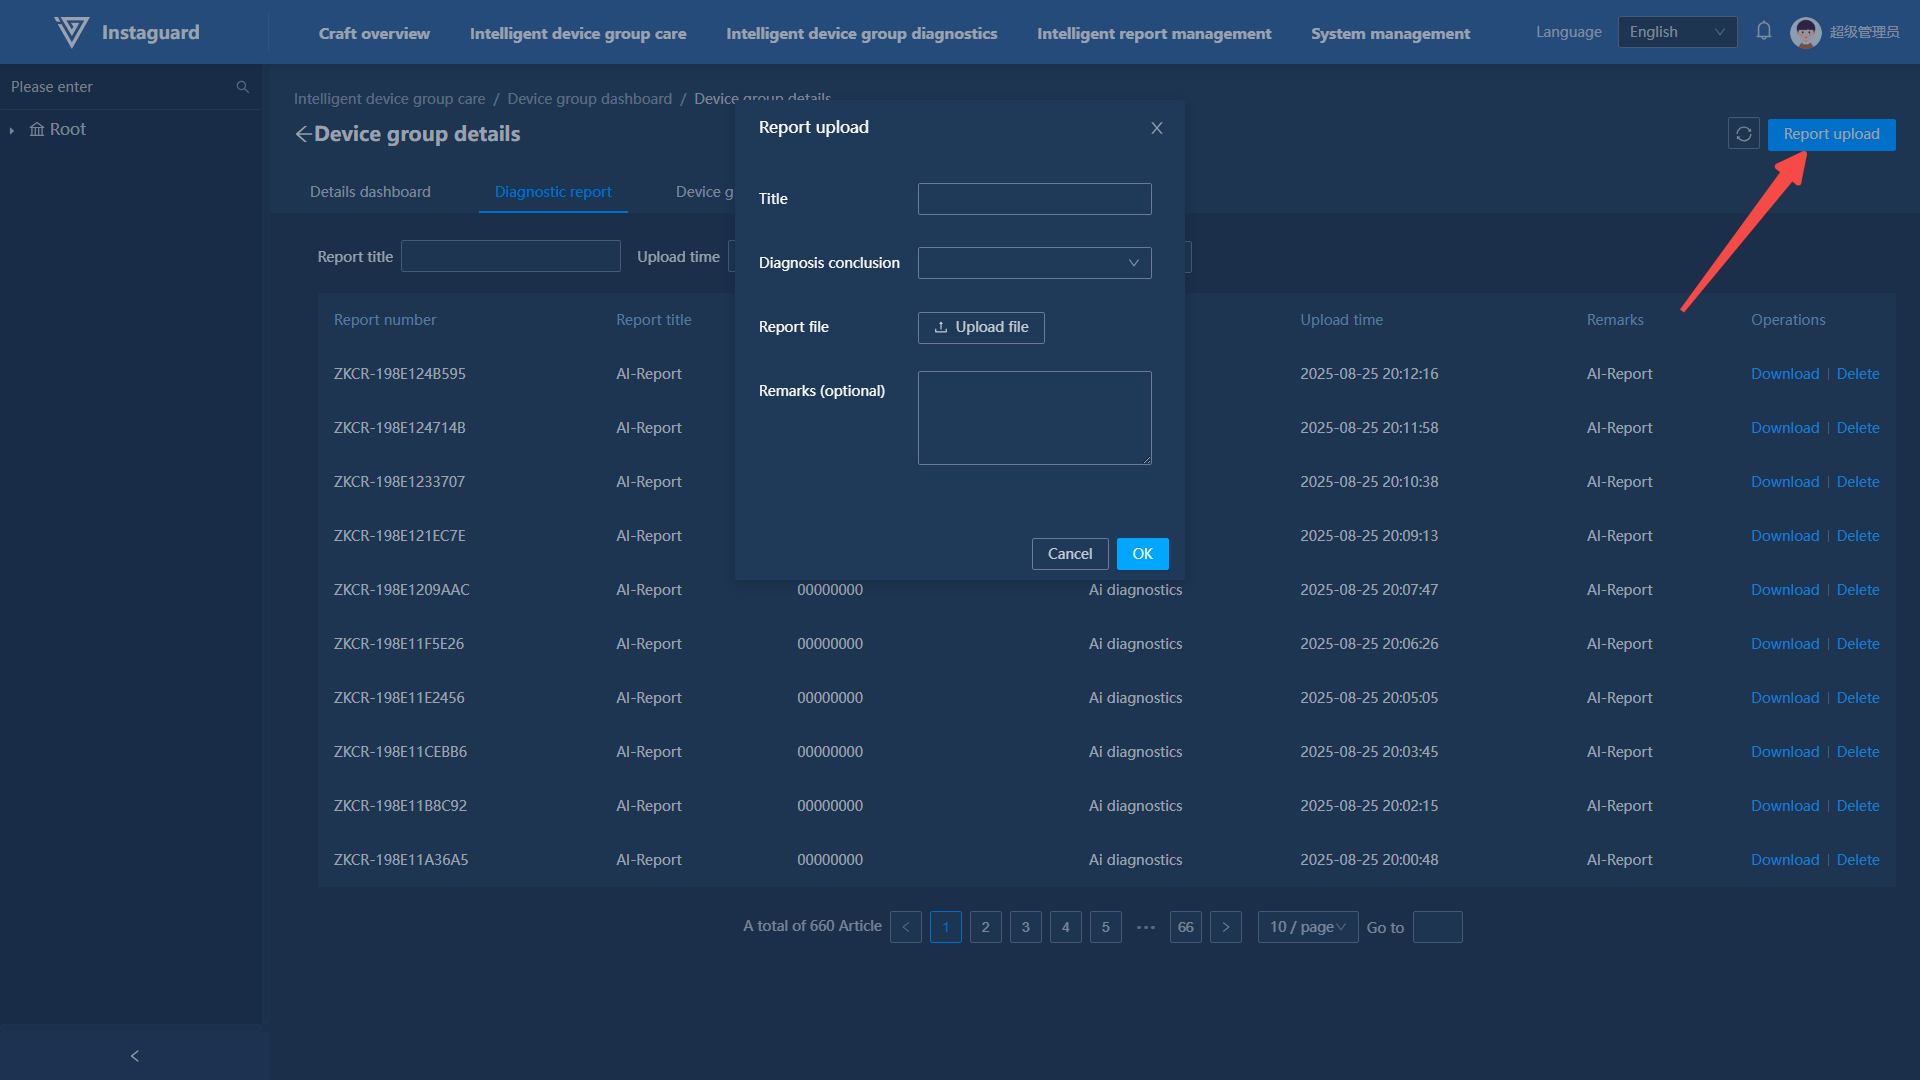
- Click "OK" to complete upload. Reports can be in any format, ≤10MB, and only one file can be uploaded at a time.
2.5 Unit Database
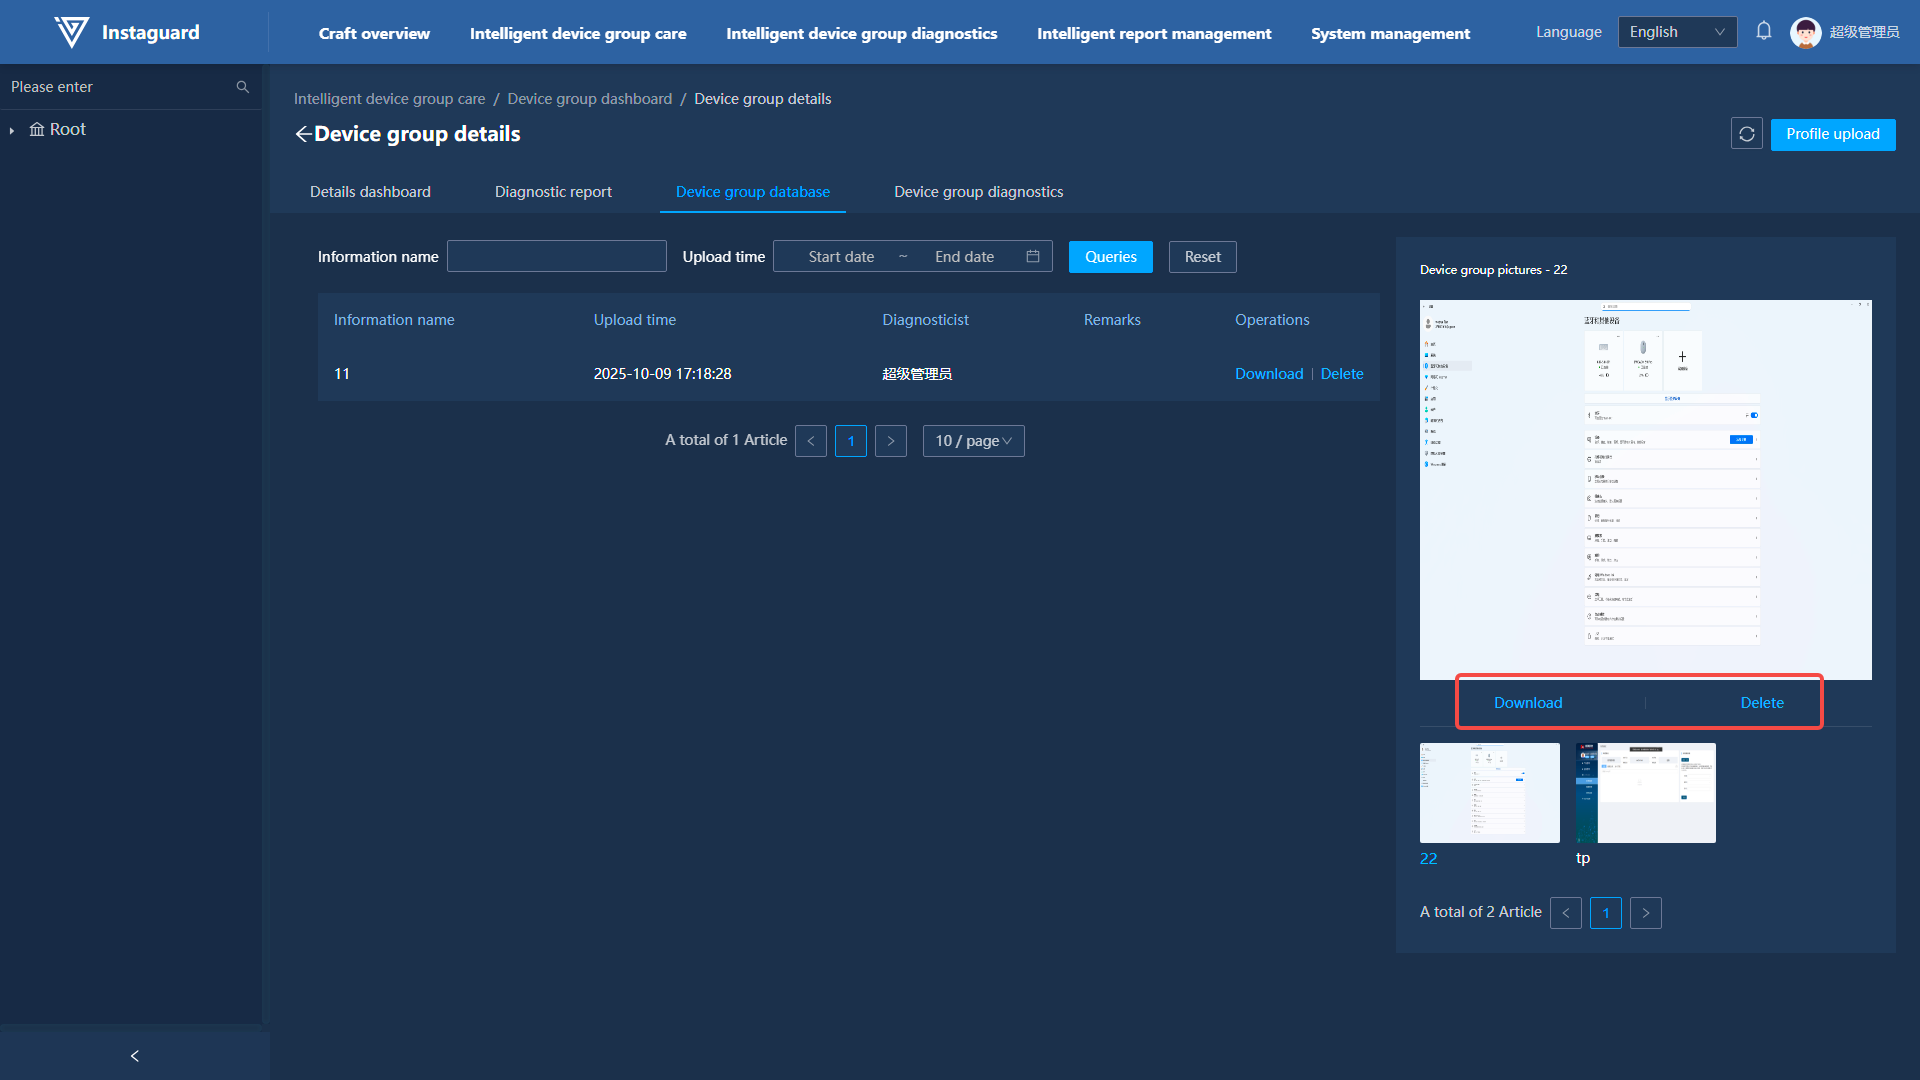
After entering unit details, click "Unit Database" to access files and images related to the unit uploaded by users.
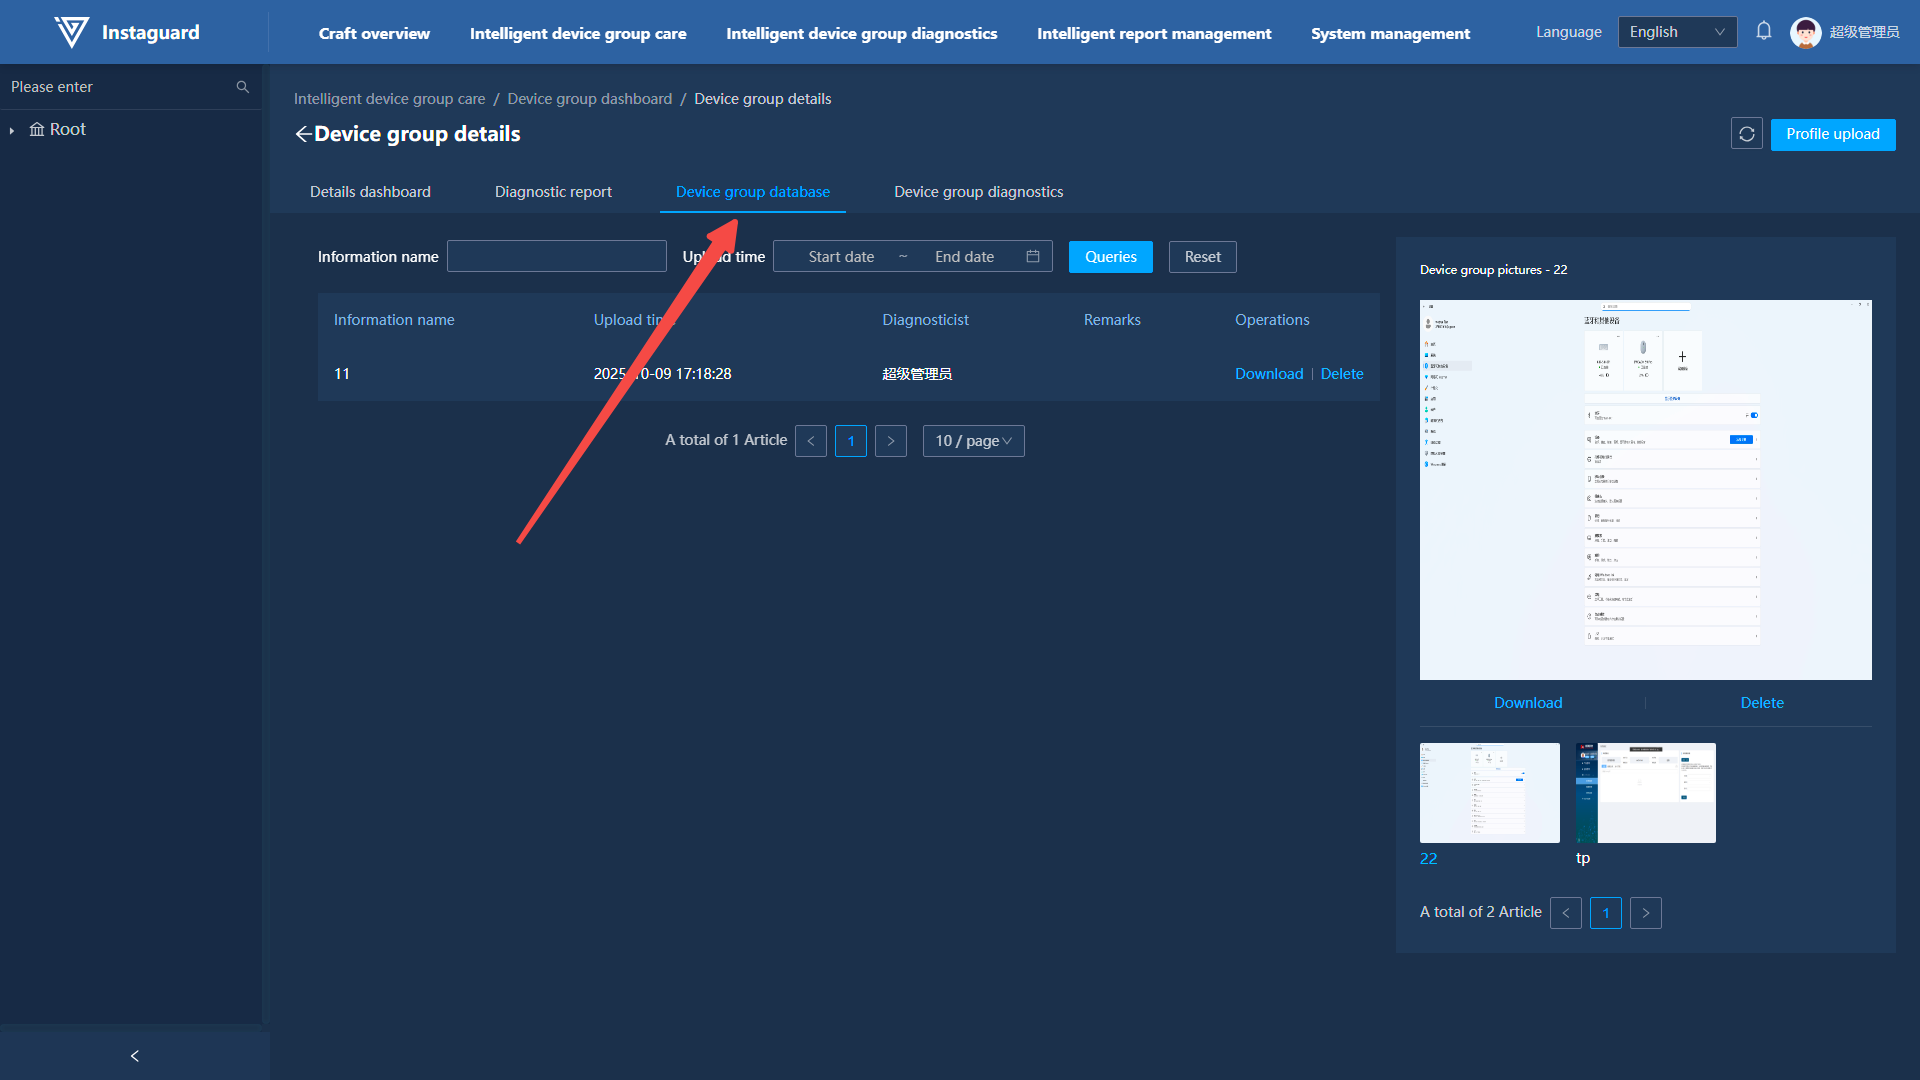
- For images, quick preview is available on the right side of the database. Click an image to view it in full and "Download" to save locally.
2.6 Unit Diagnosis
Click "Unit Diagnosis" to jump to 「Intelligent Unit Diagnosis」 → 「Diagnosis View」.
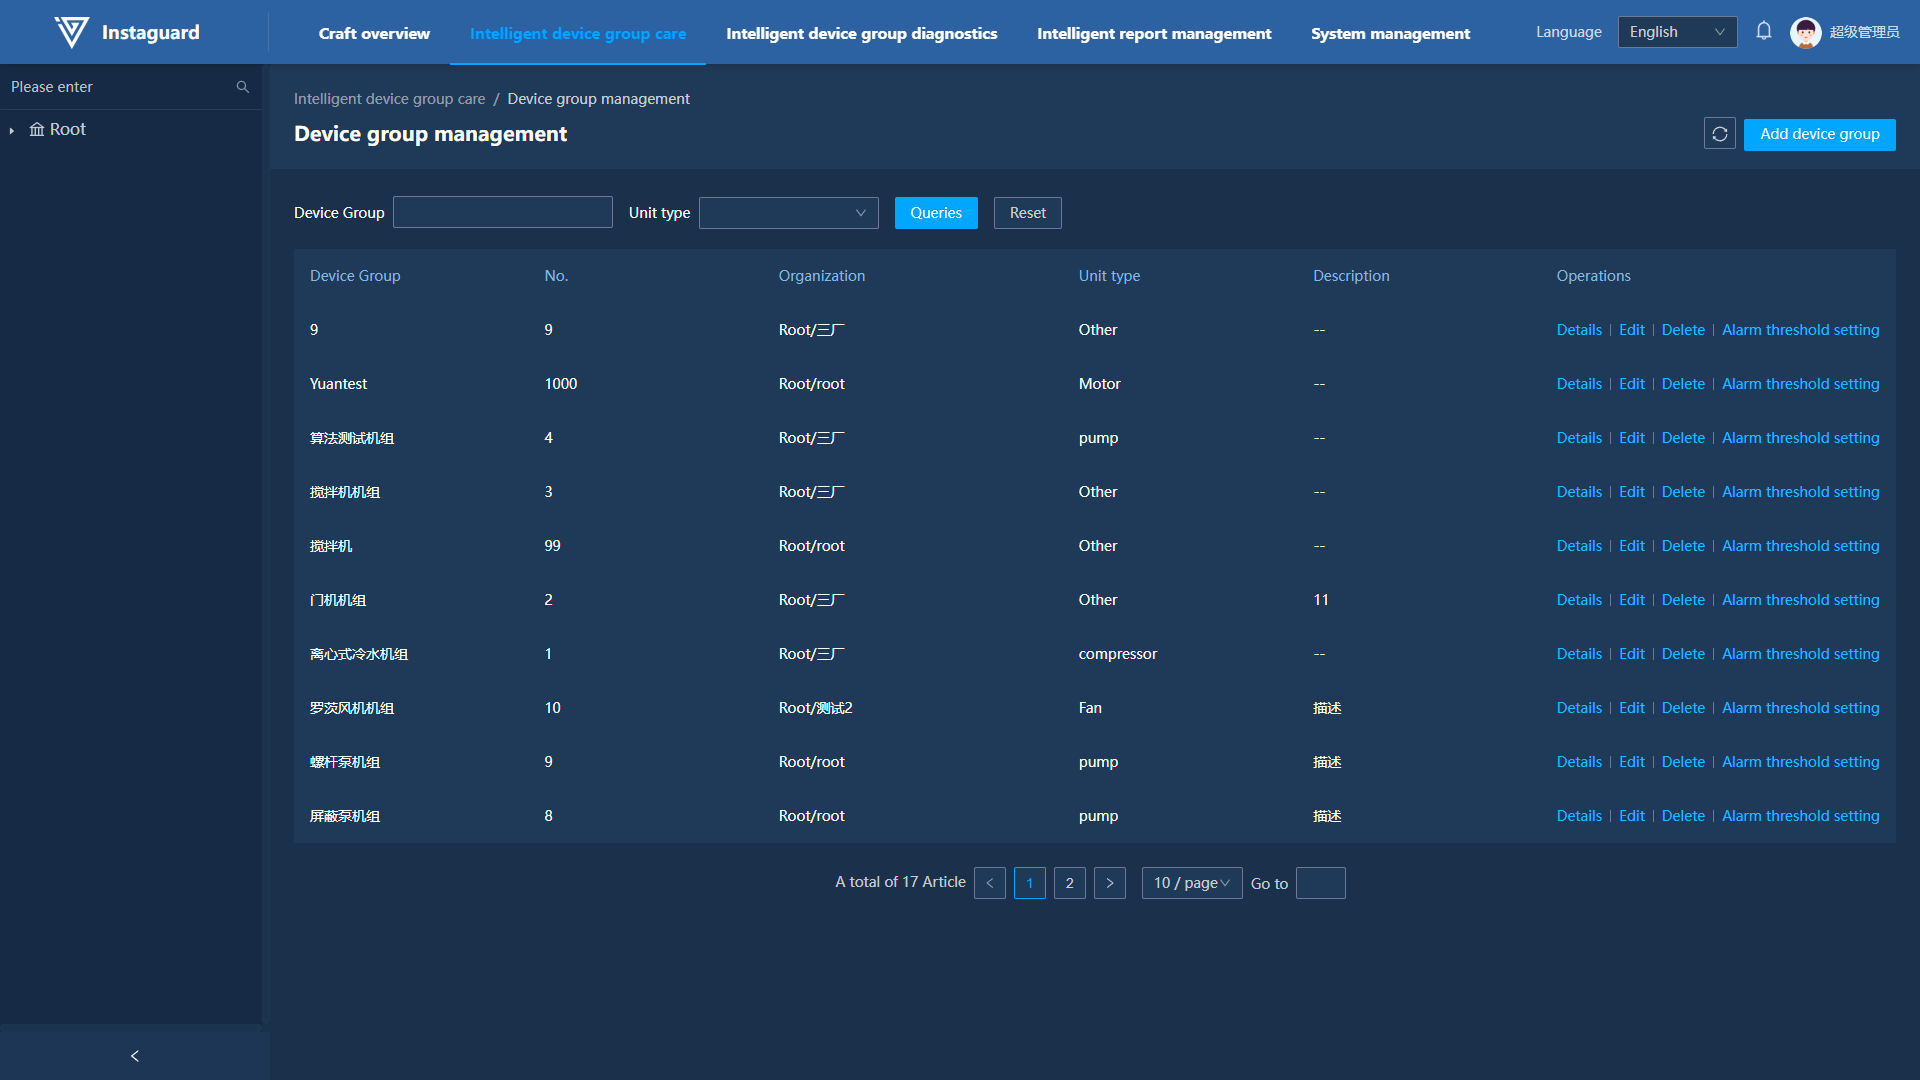
3. Unit Management
3.1 Navigation Path
「Intelligent Unit Care」 → 「Unit Management」
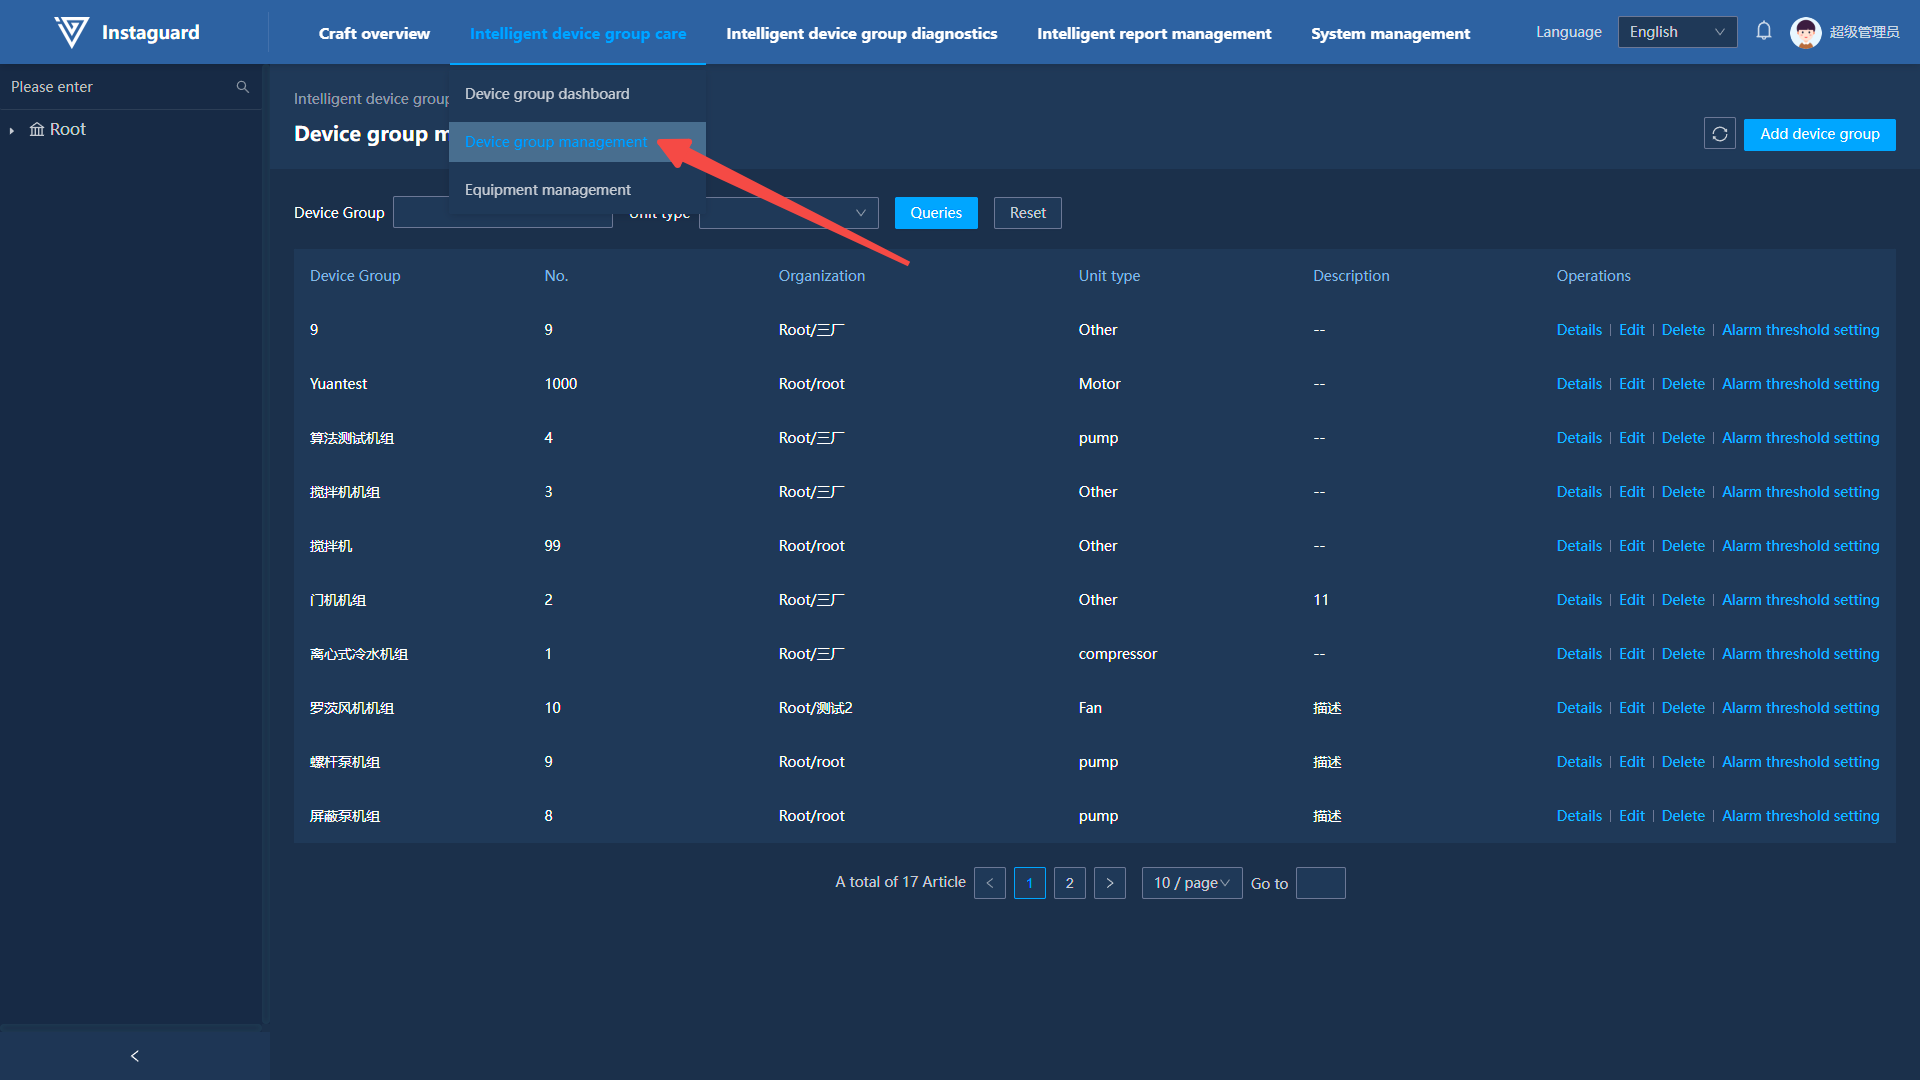
3.2 Function Overview
Unit management enables ledger management (account management) of all units within the governing organization and viewing parameters/information of subordinate devices. Unit tag numbers must be unique within the same organization.
3.3 Adding Units
In Unit Management, click "Add Unit" in the upper-right corner to open the addition page.
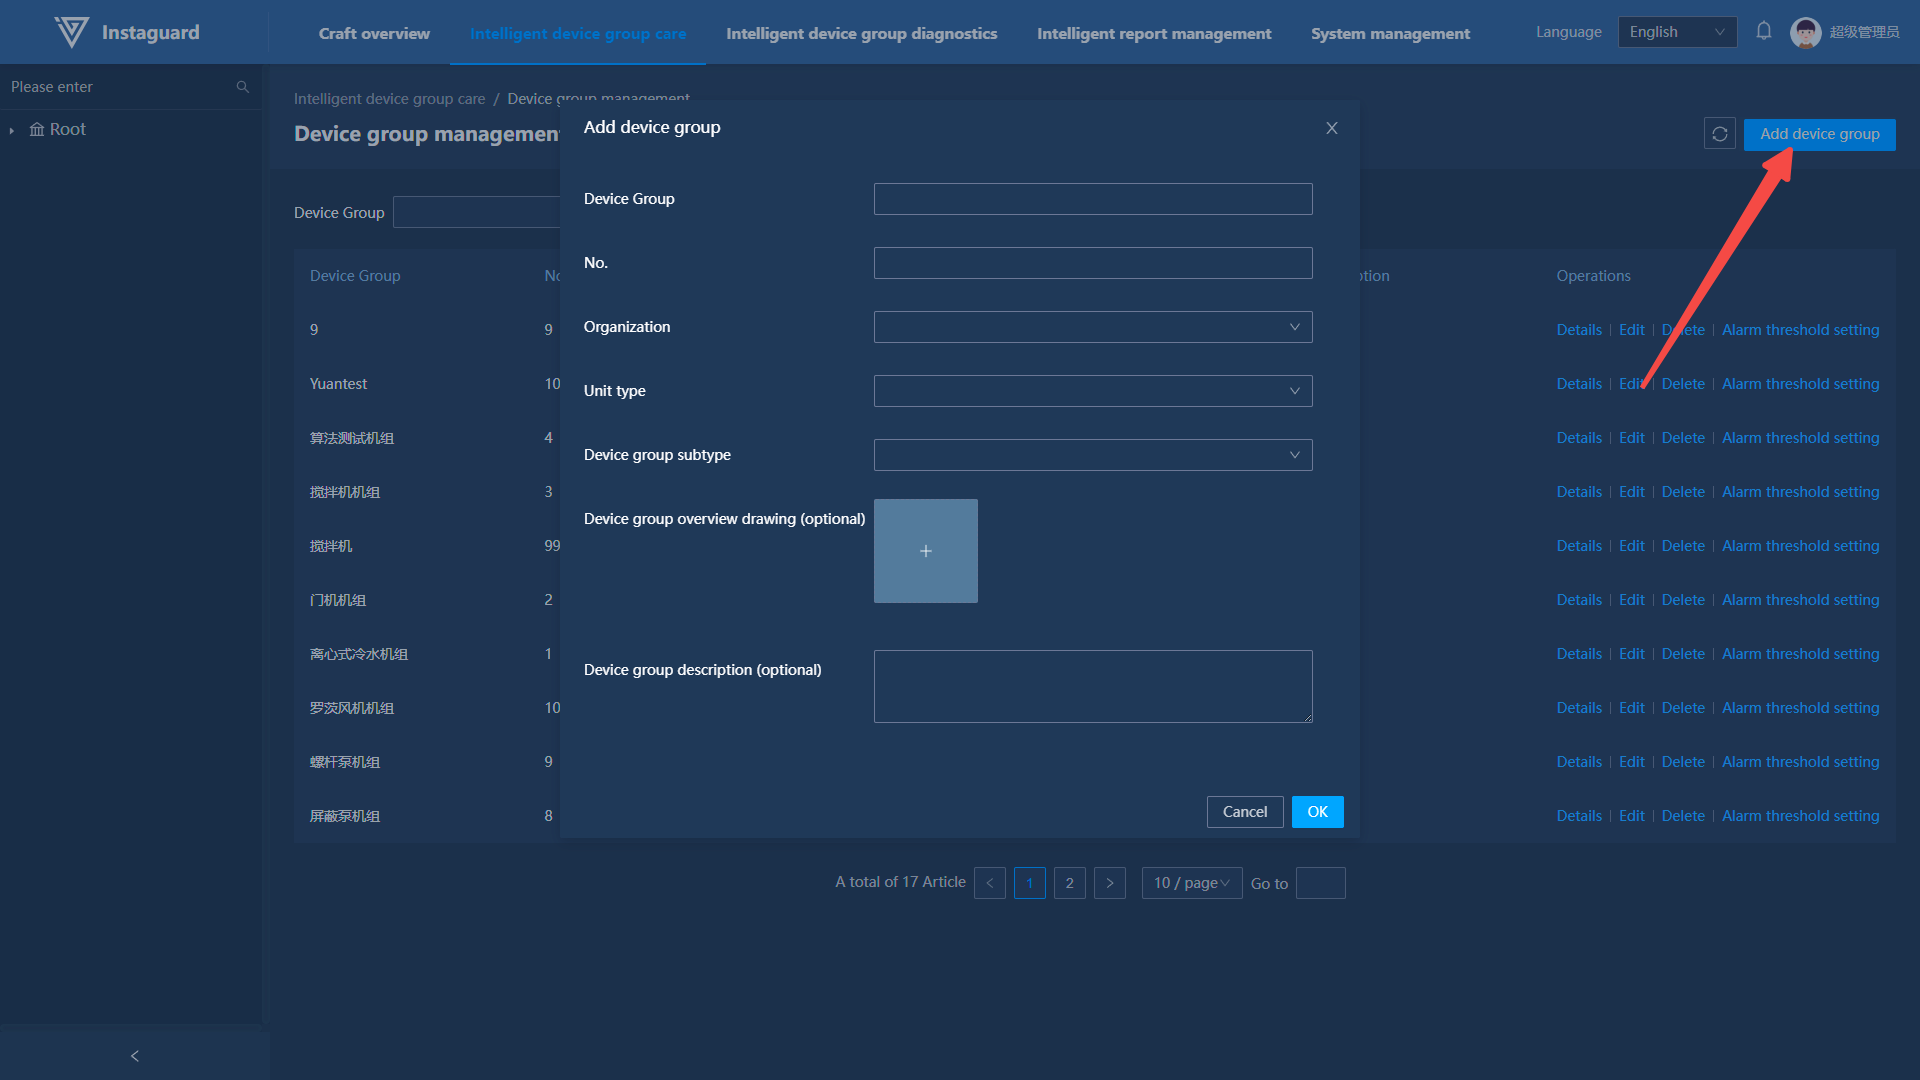
-
Unit tag numbers must be unique within the organization. Users can upload an overview image, which will display in the unit kanban, details, and intelligent dashboard. If not uploaded, the system assigns an image based on the unit type.
3.4 Editing Units
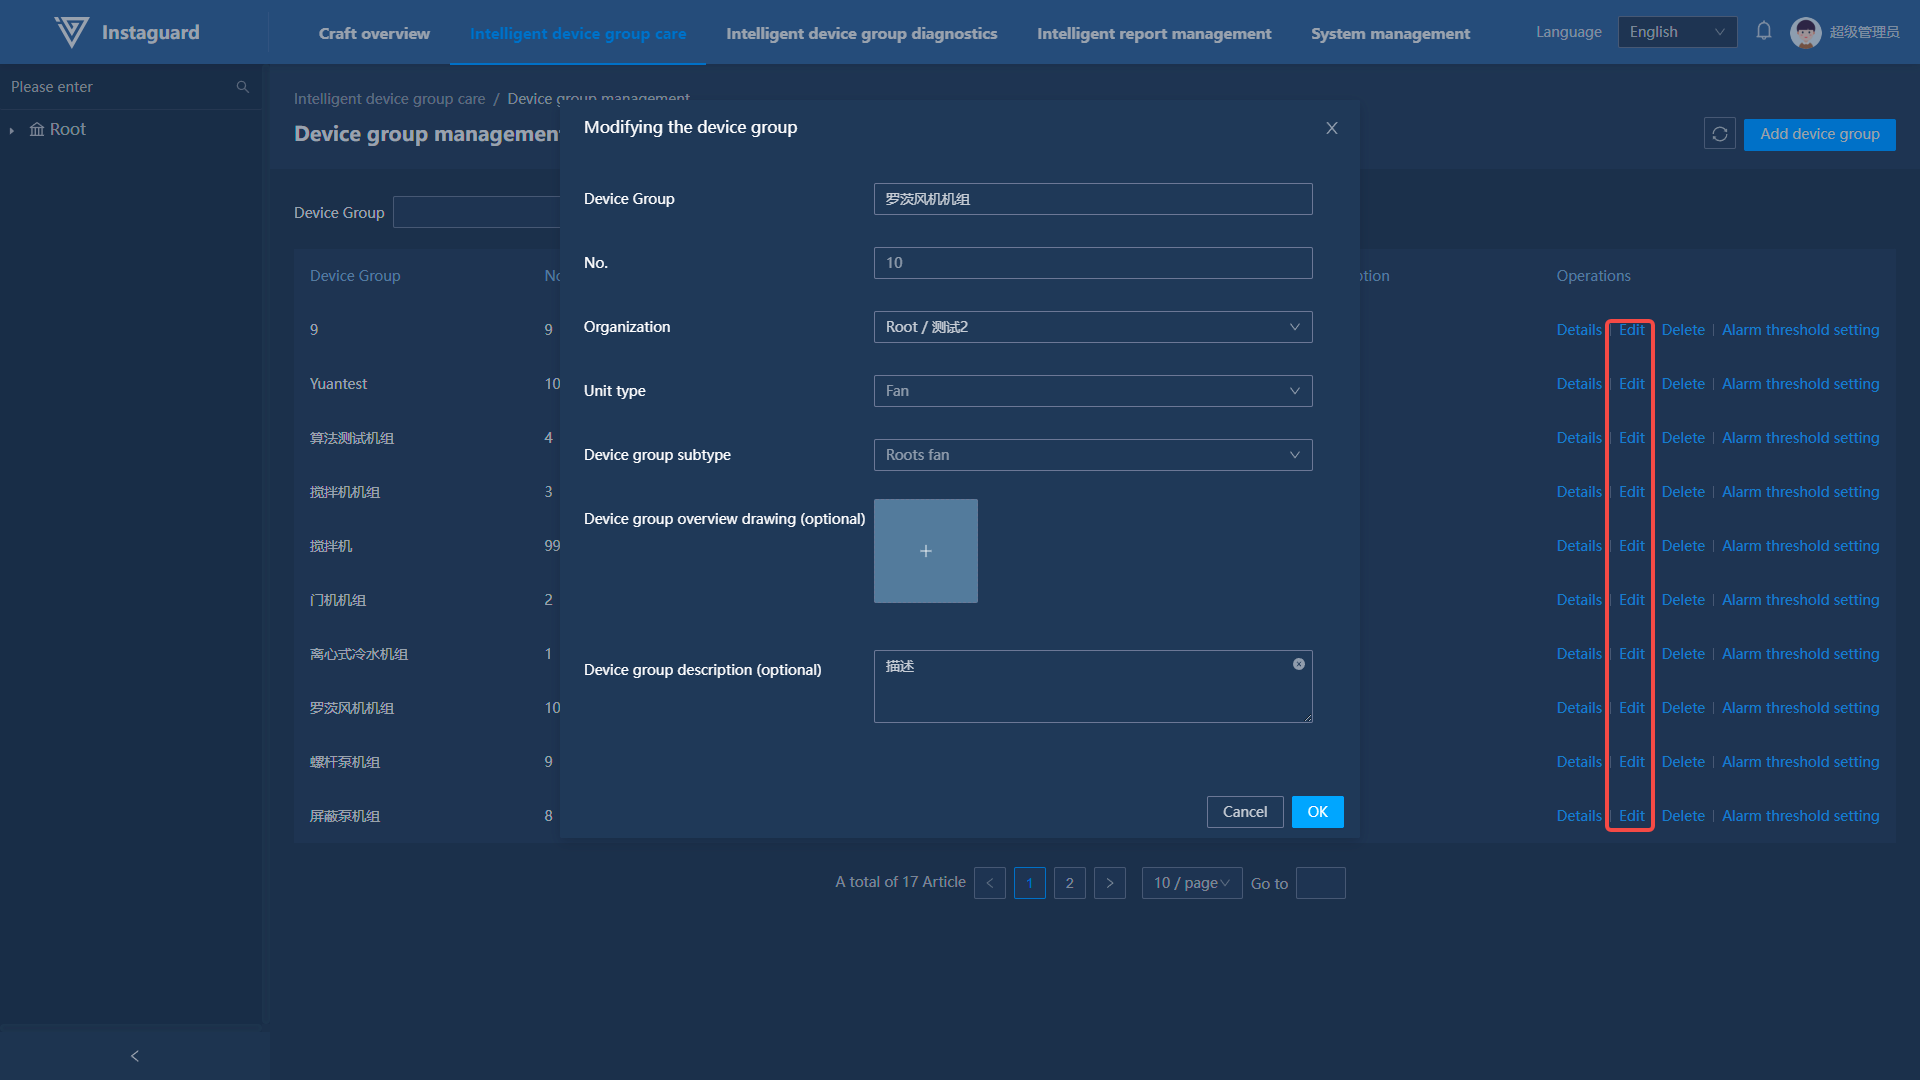
In Unit Management, click "Edit" for a specified unit to open the editing page.
-
Unit tag numbers, organization, and structure cannot be edited. Users can upload/change the overview image as with adding units.
3.5 Unit Details
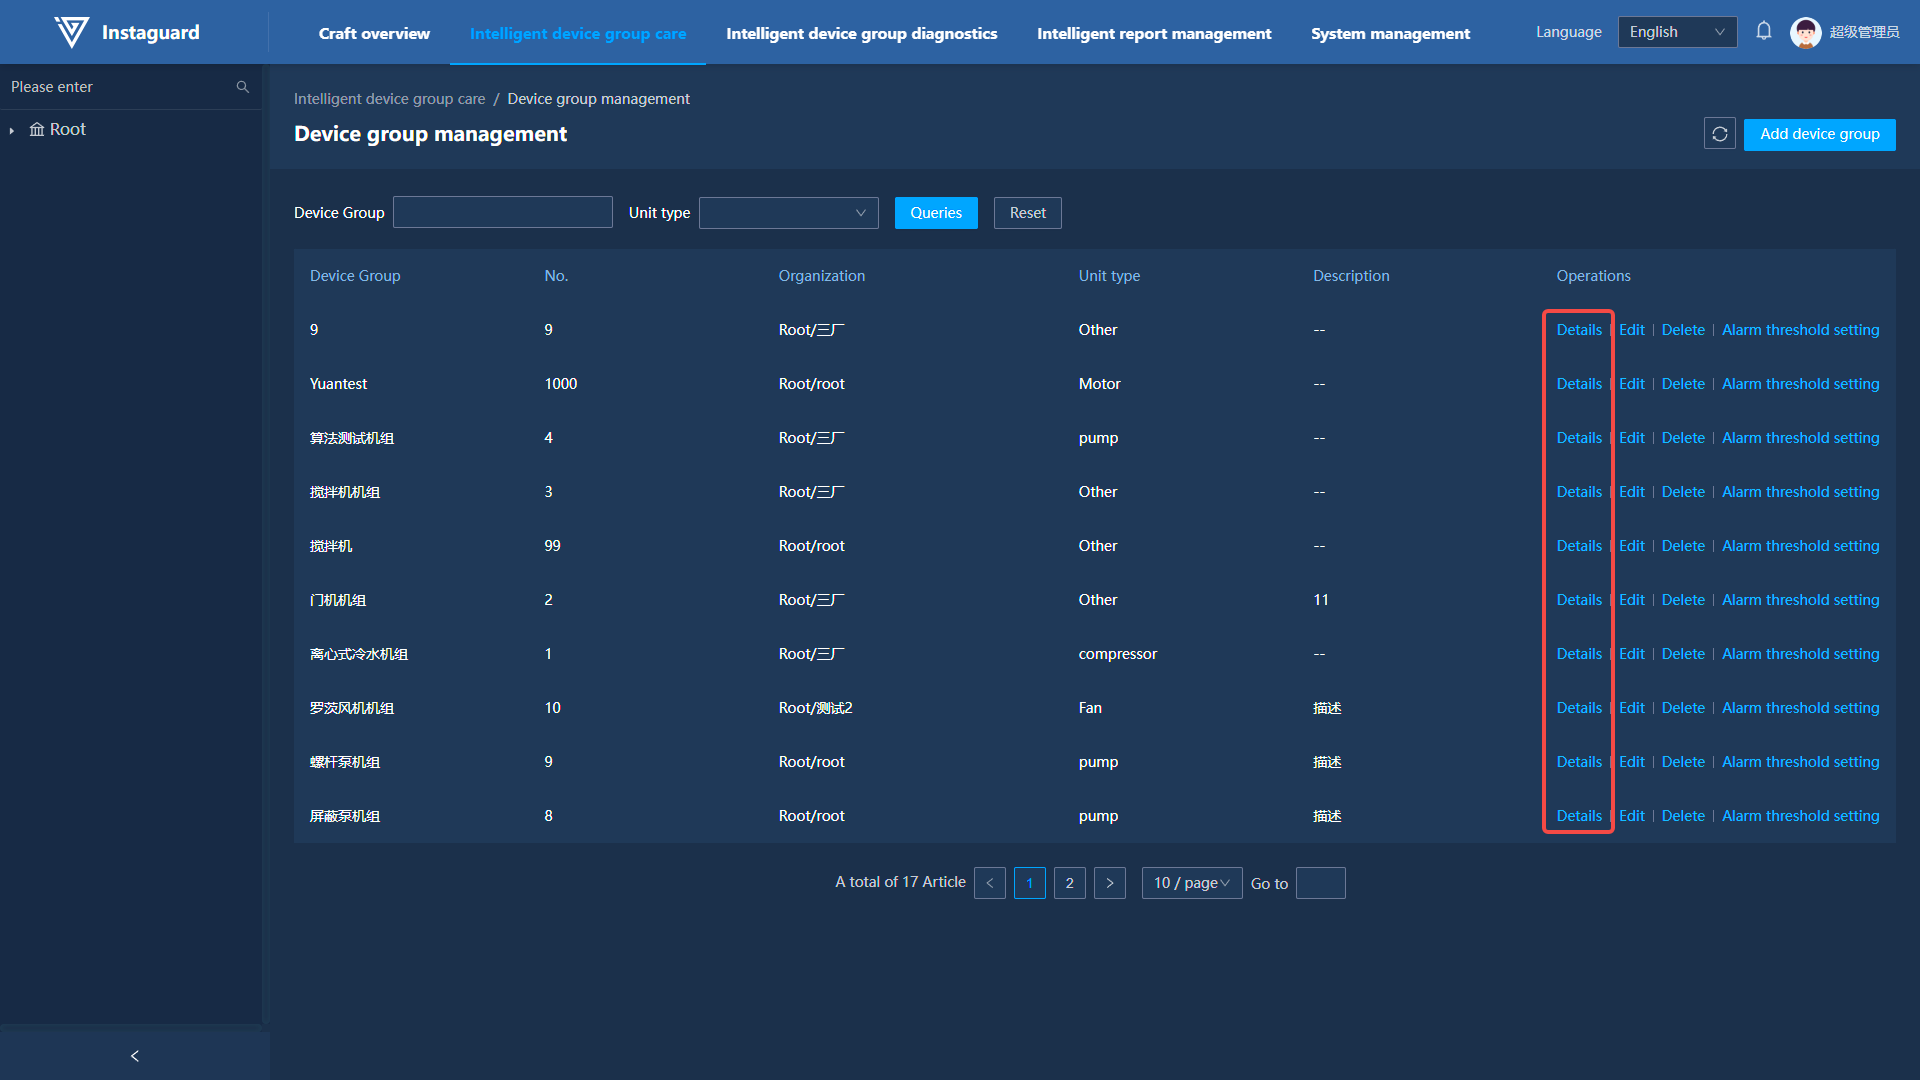
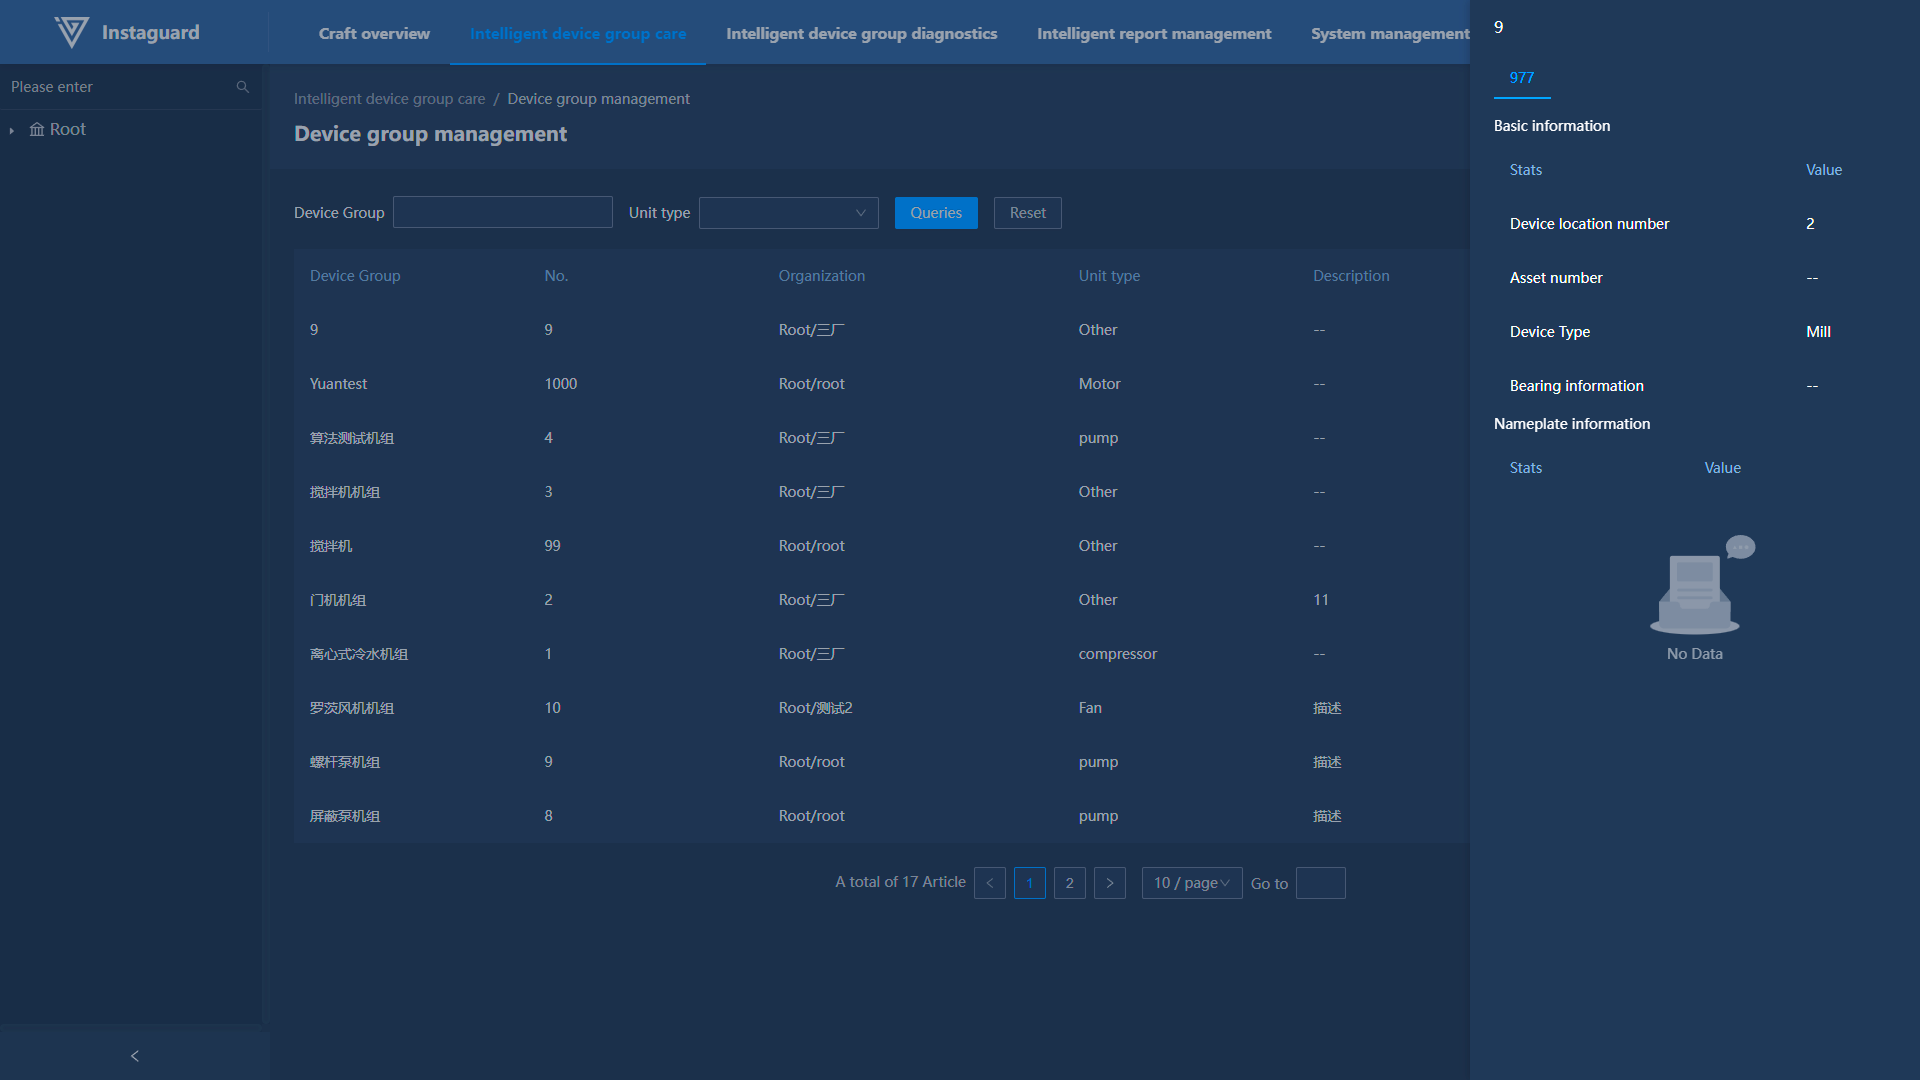
In Unit Management, click "Details" for a specified unit to display details of all subordinate devices on the right.
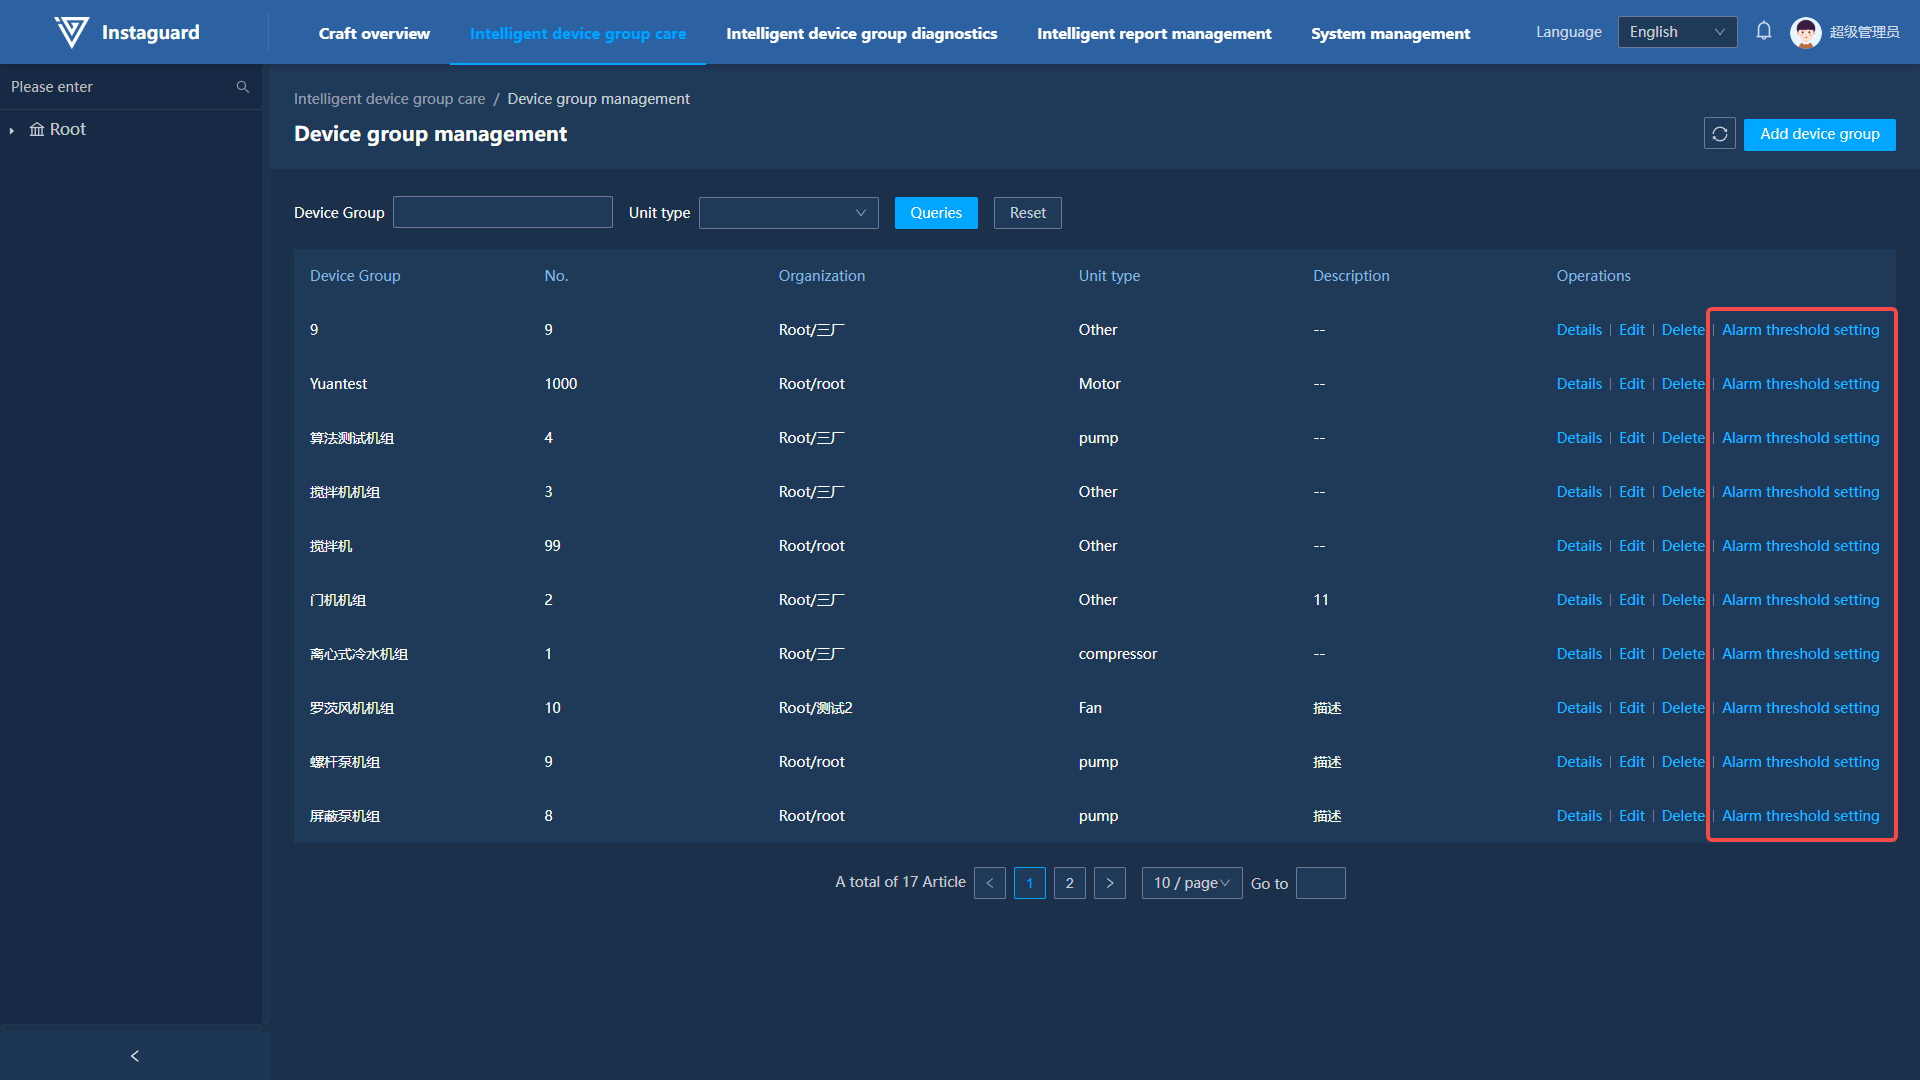
3.6 Alarm Threshold Setting
Click "Alarm Threshold Setting" to set thresholds in the pop-up window (same as unit details).
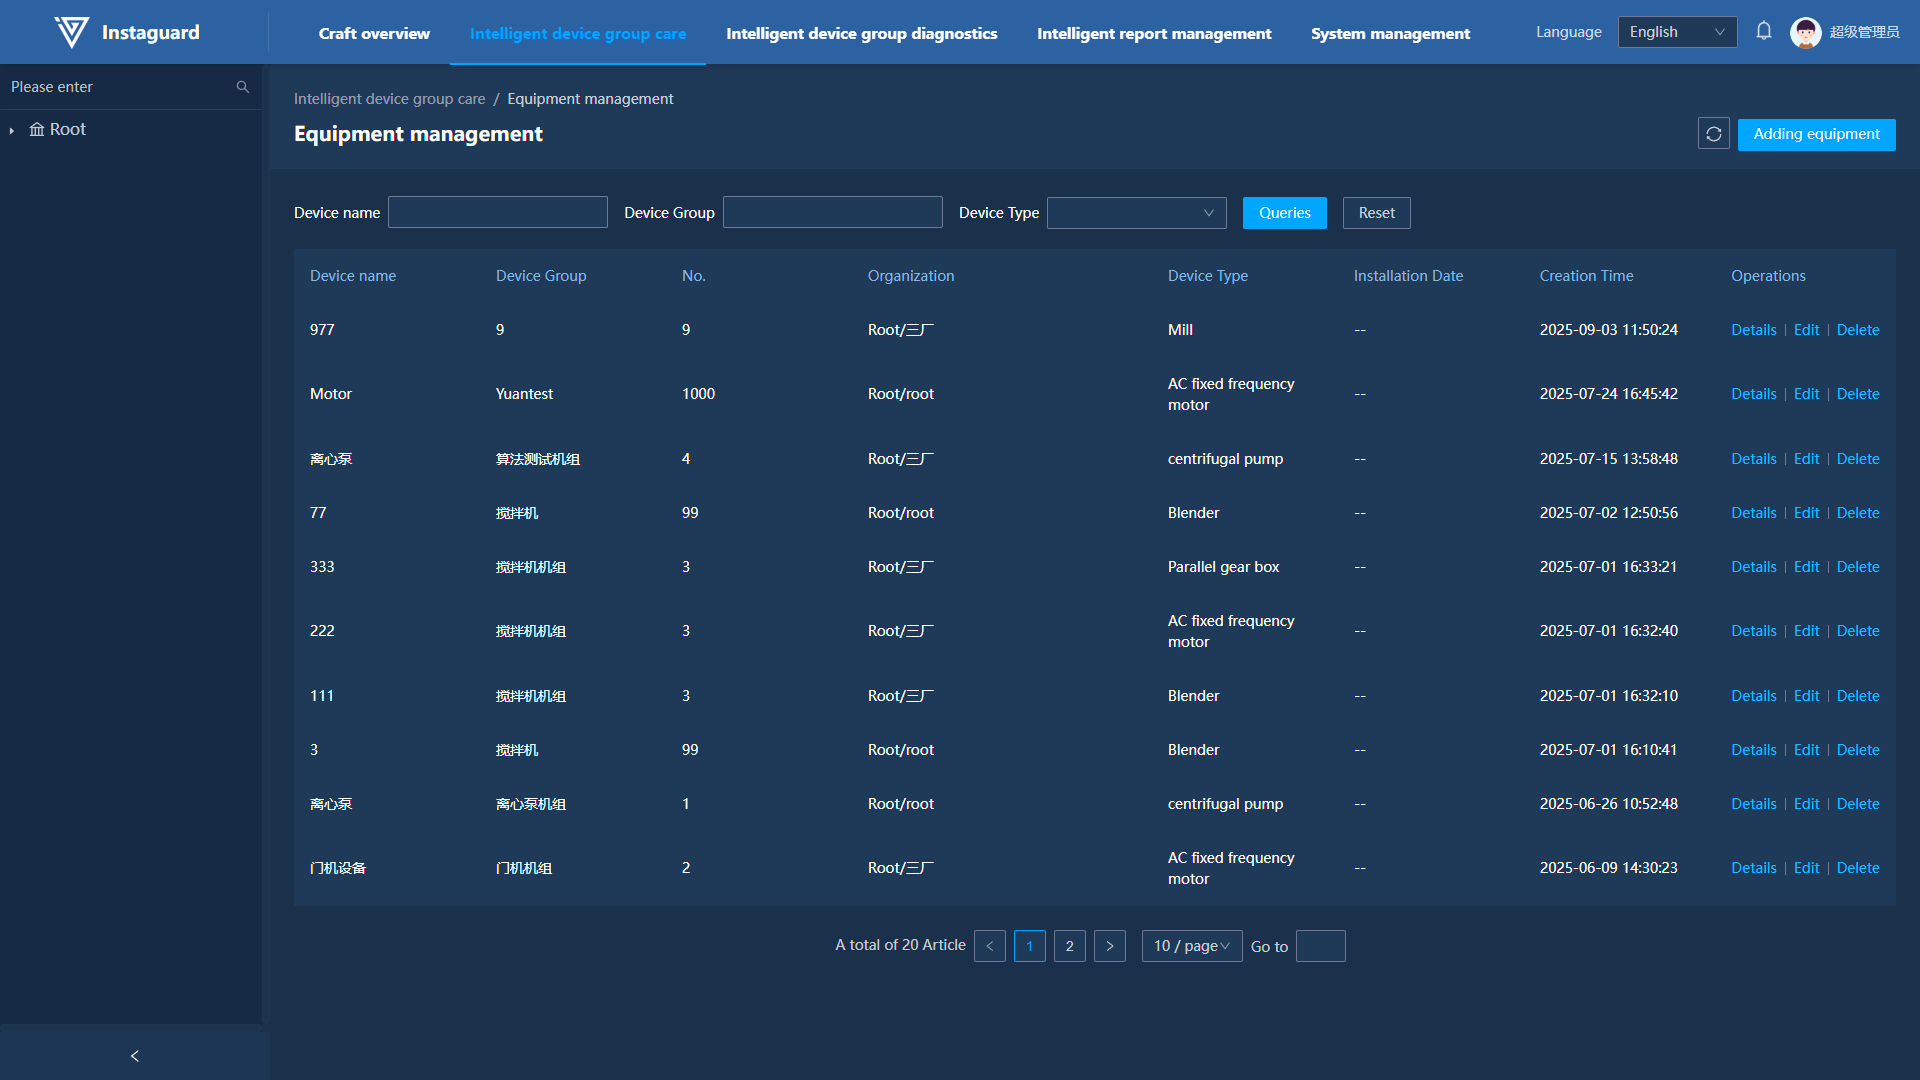
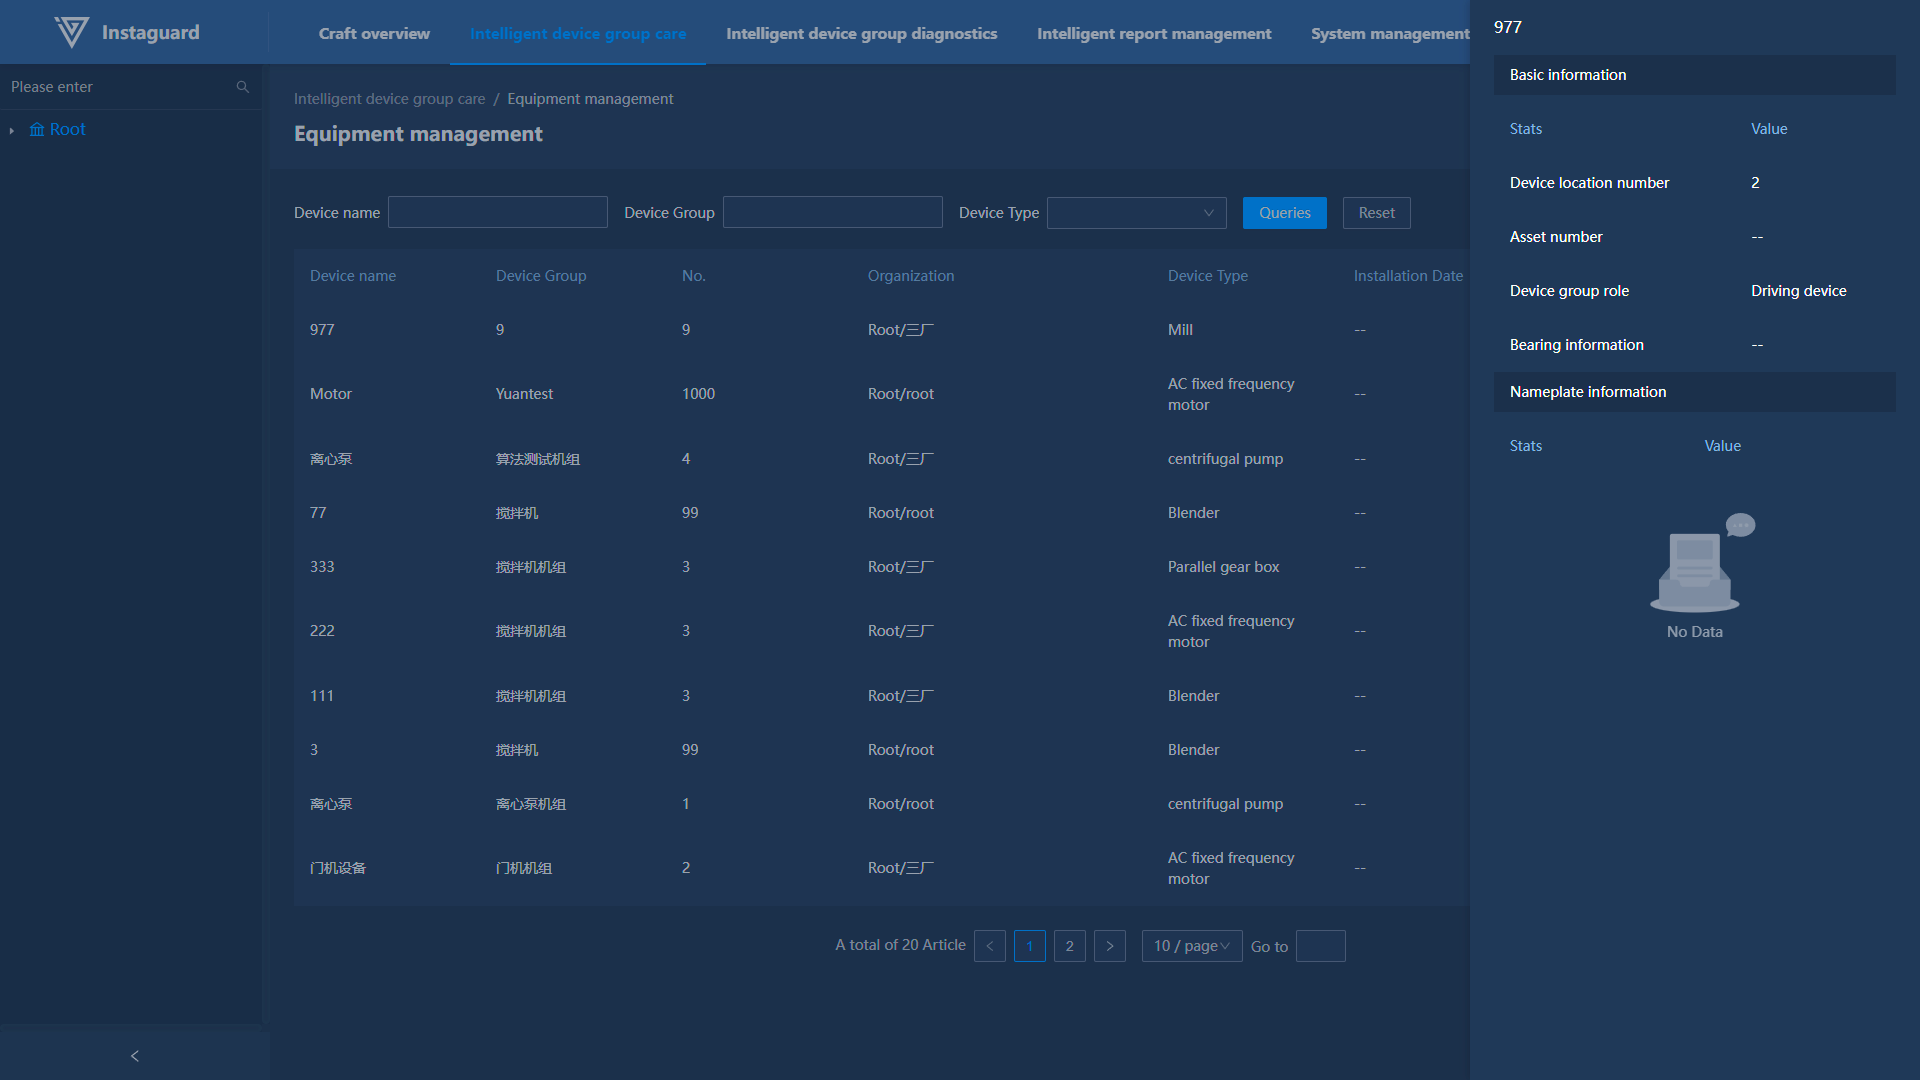
4. Device Management
4.1 Navigation Path
「Intelligent Unit Care」 → 「Device Management」
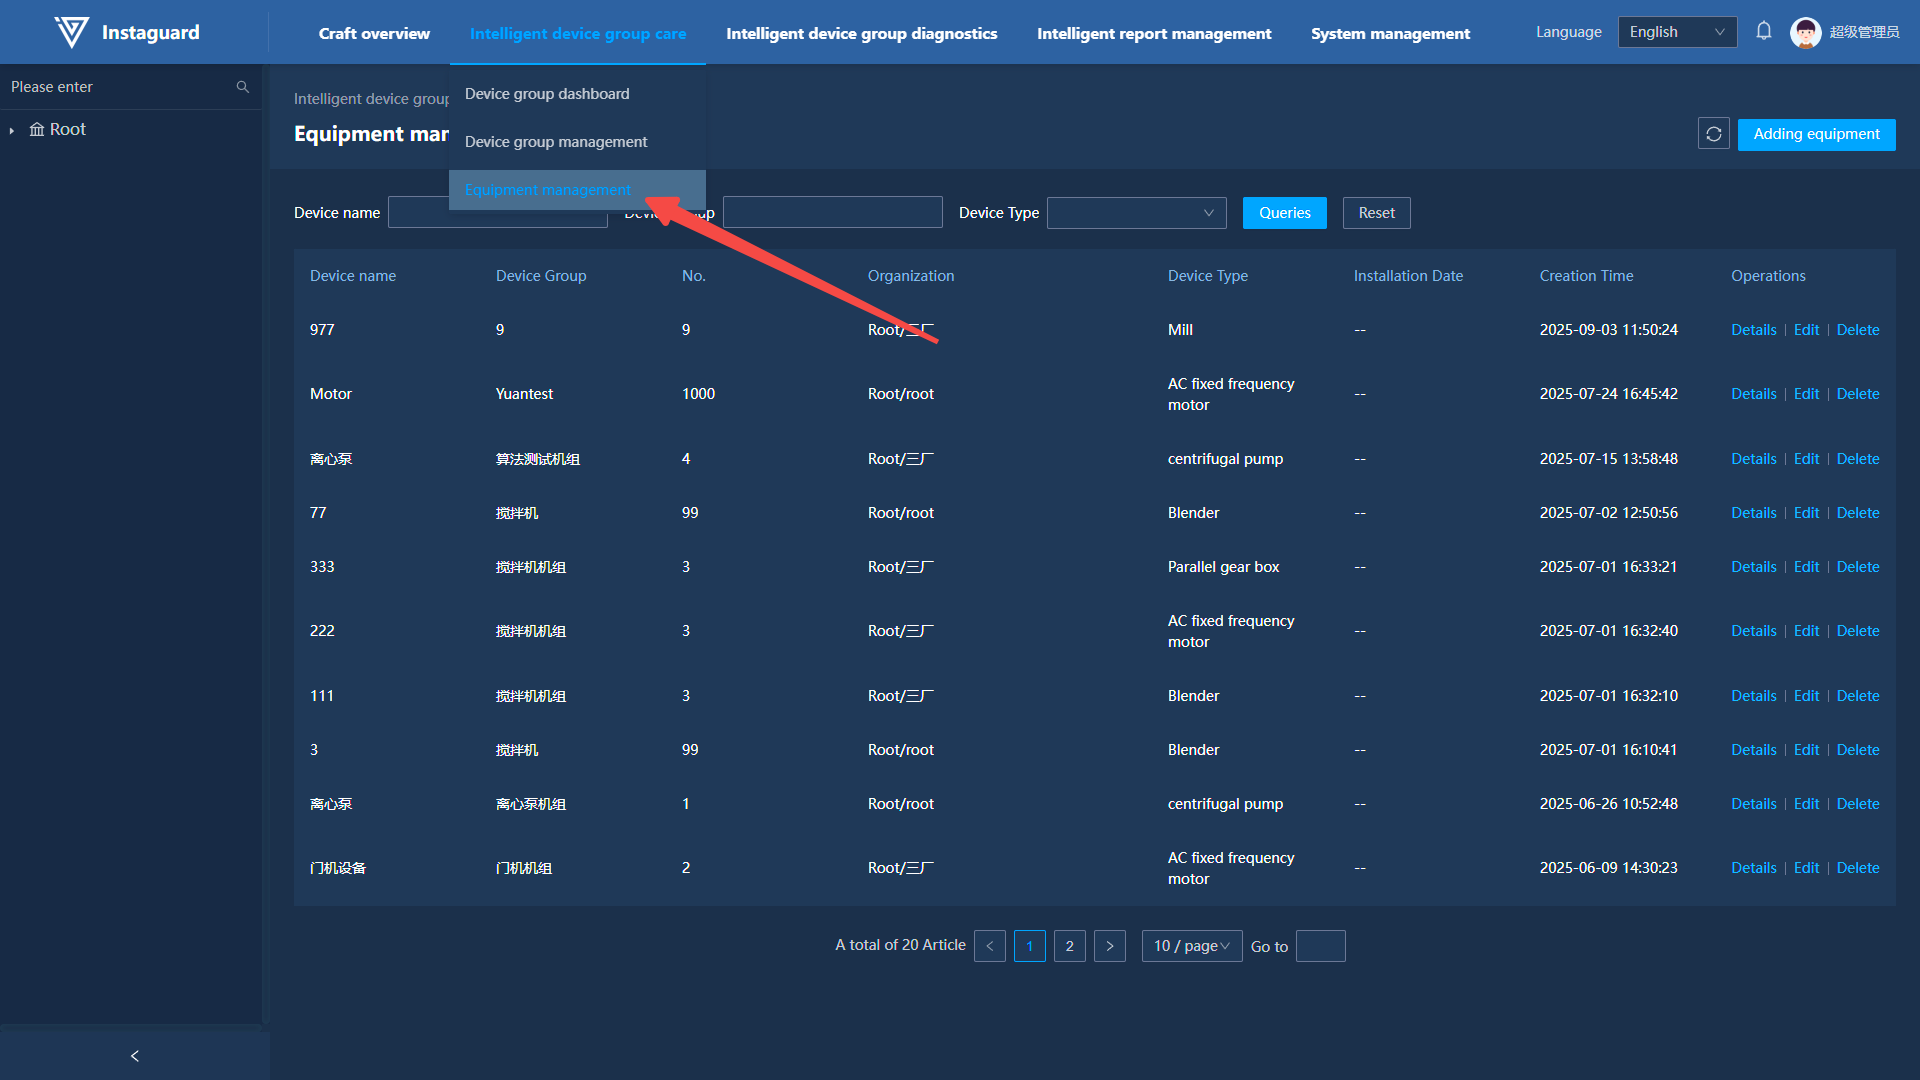
4.2 Function Overview
Device management enables ledger management (account management) of all devices within the governing organization and viewing parameter information of specified devices. Position numbers must be unique within the same unit.
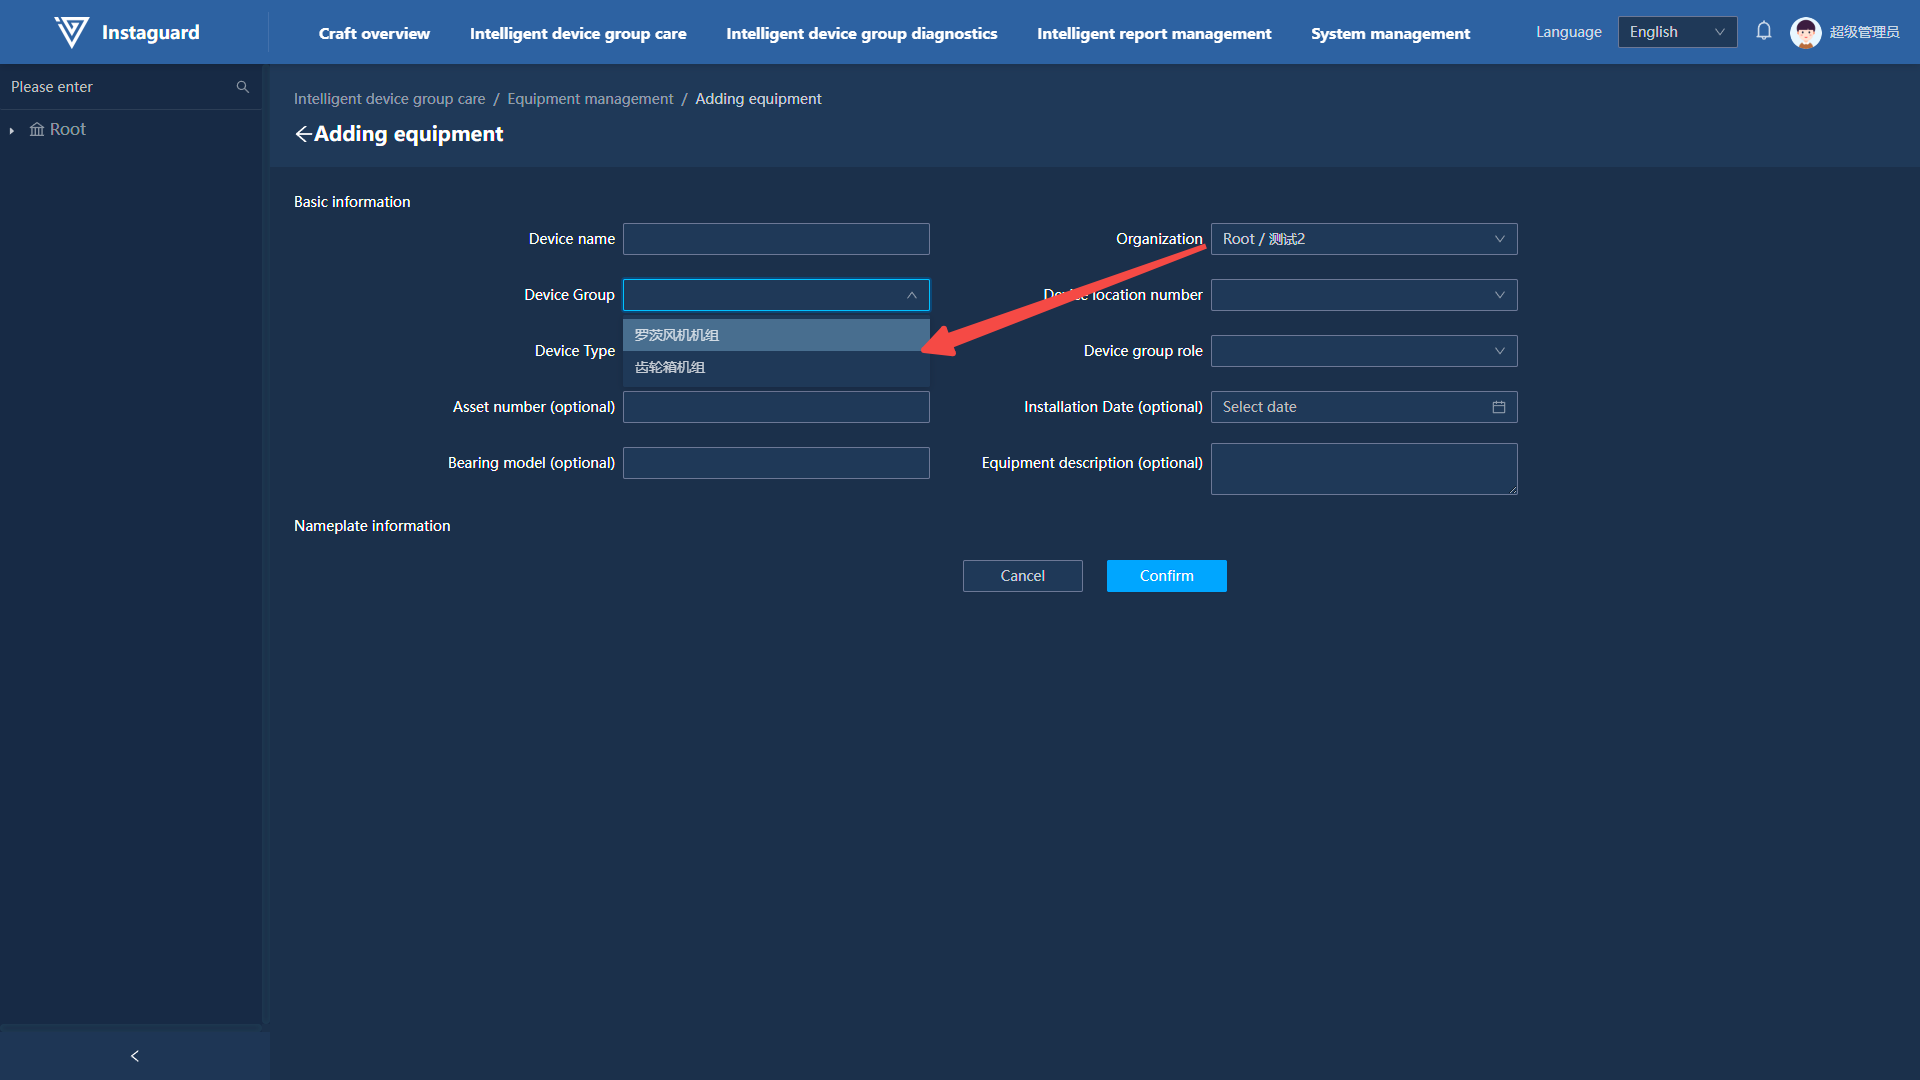
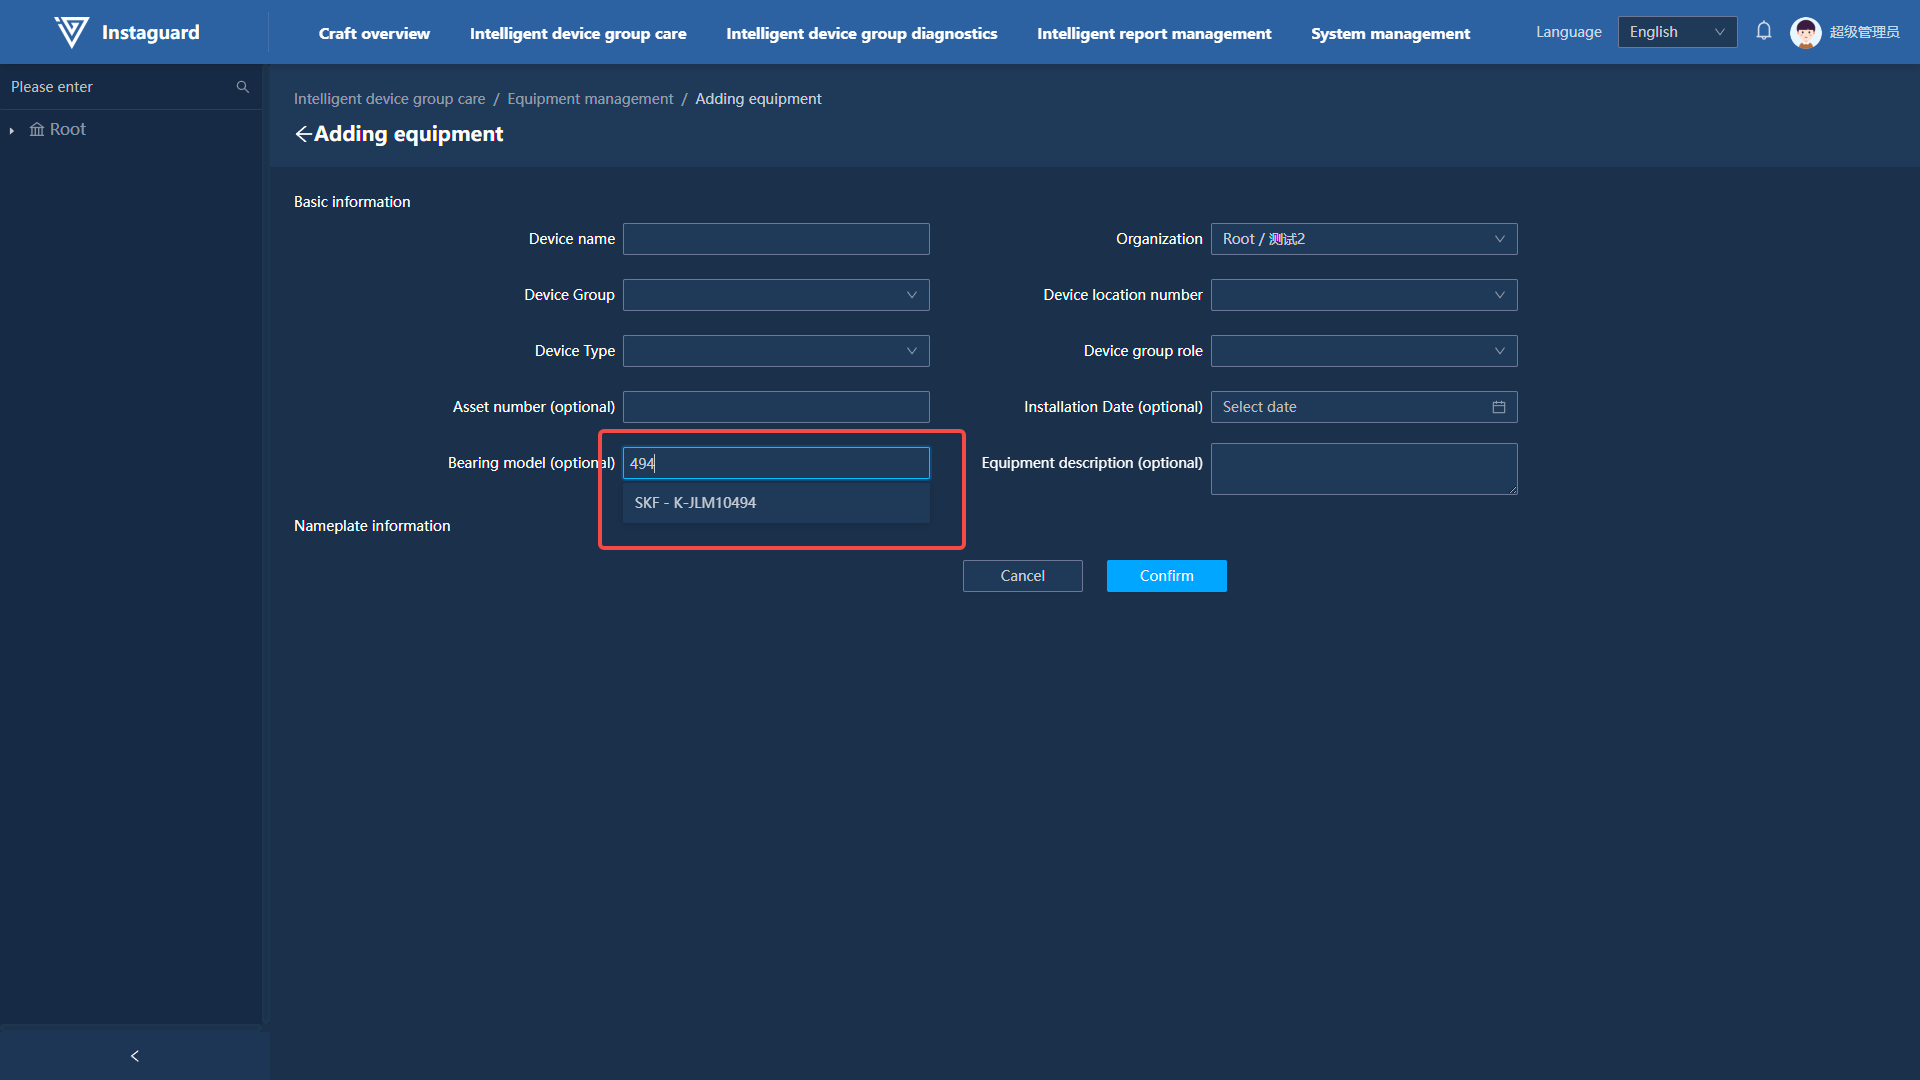
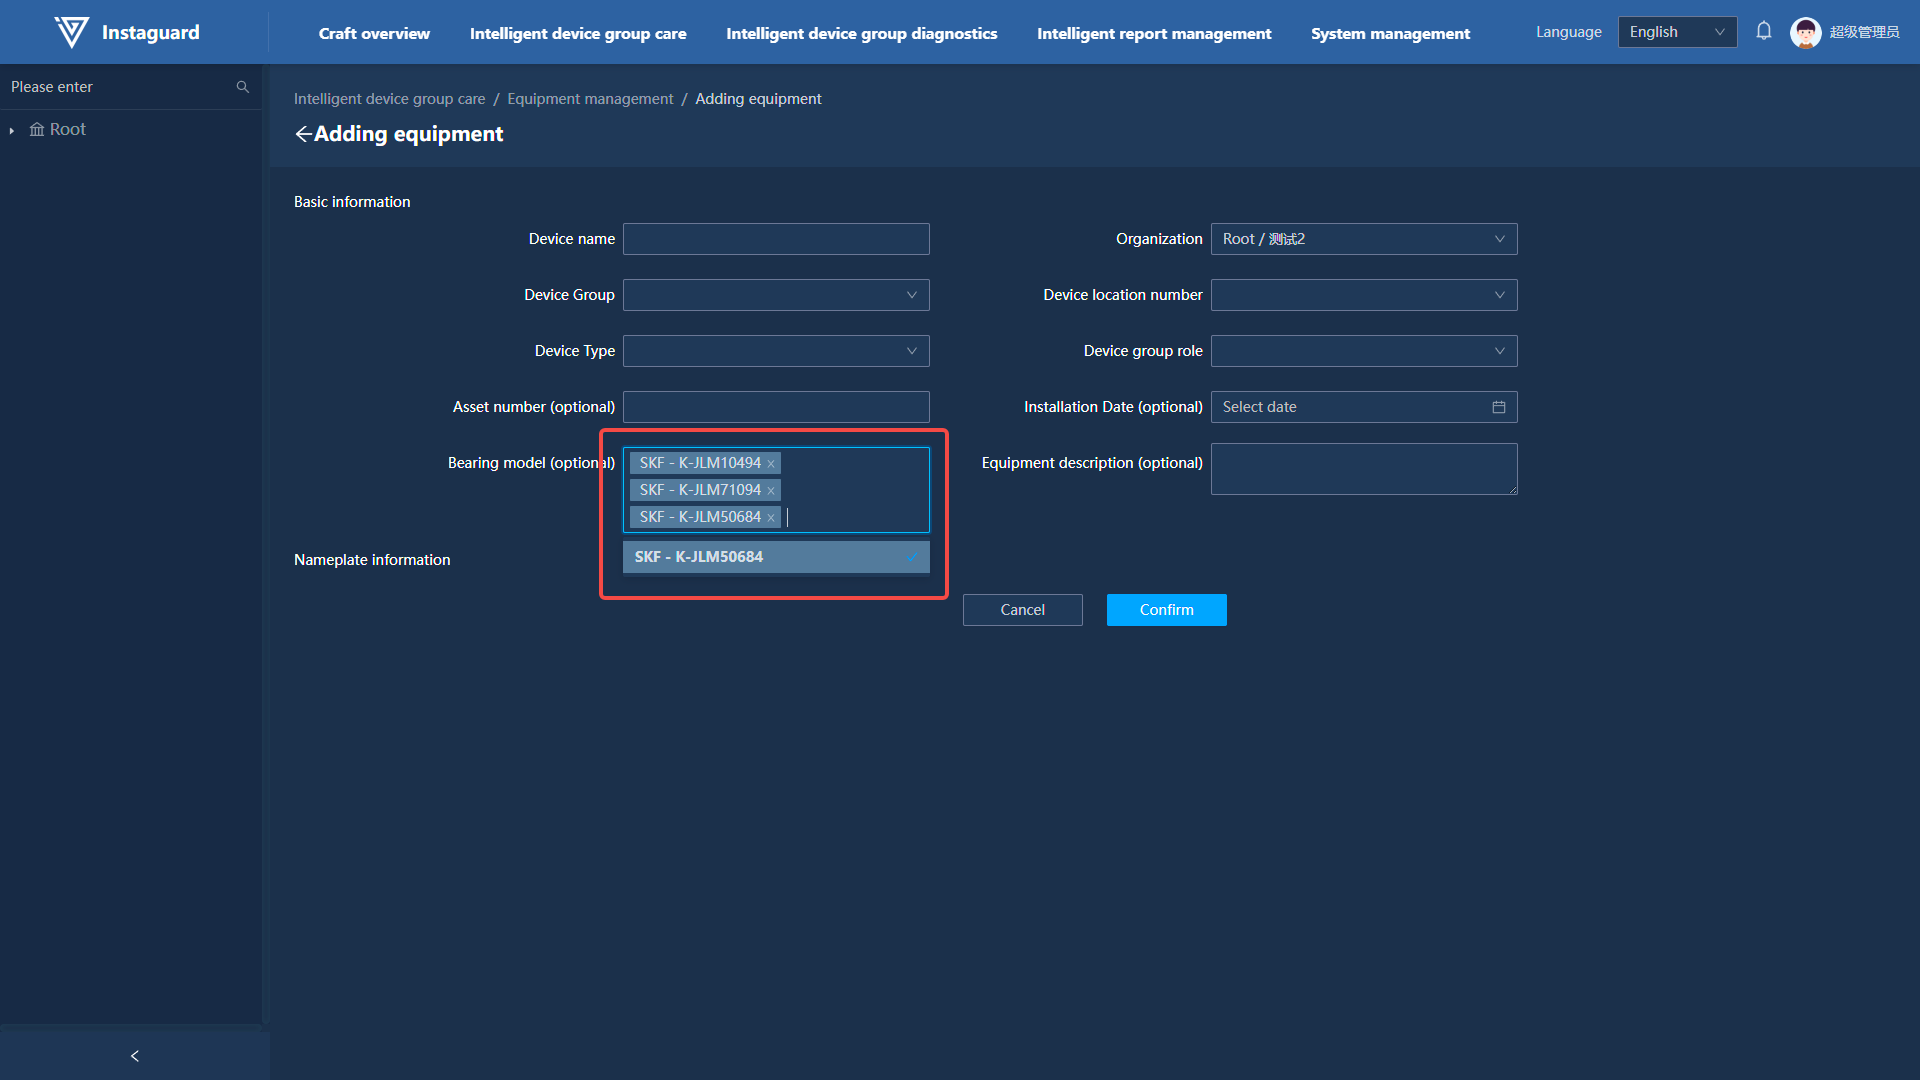
4.3 Adding Devices
In Device Management, click "Add Device" in the upper-right corner to open the addition page.
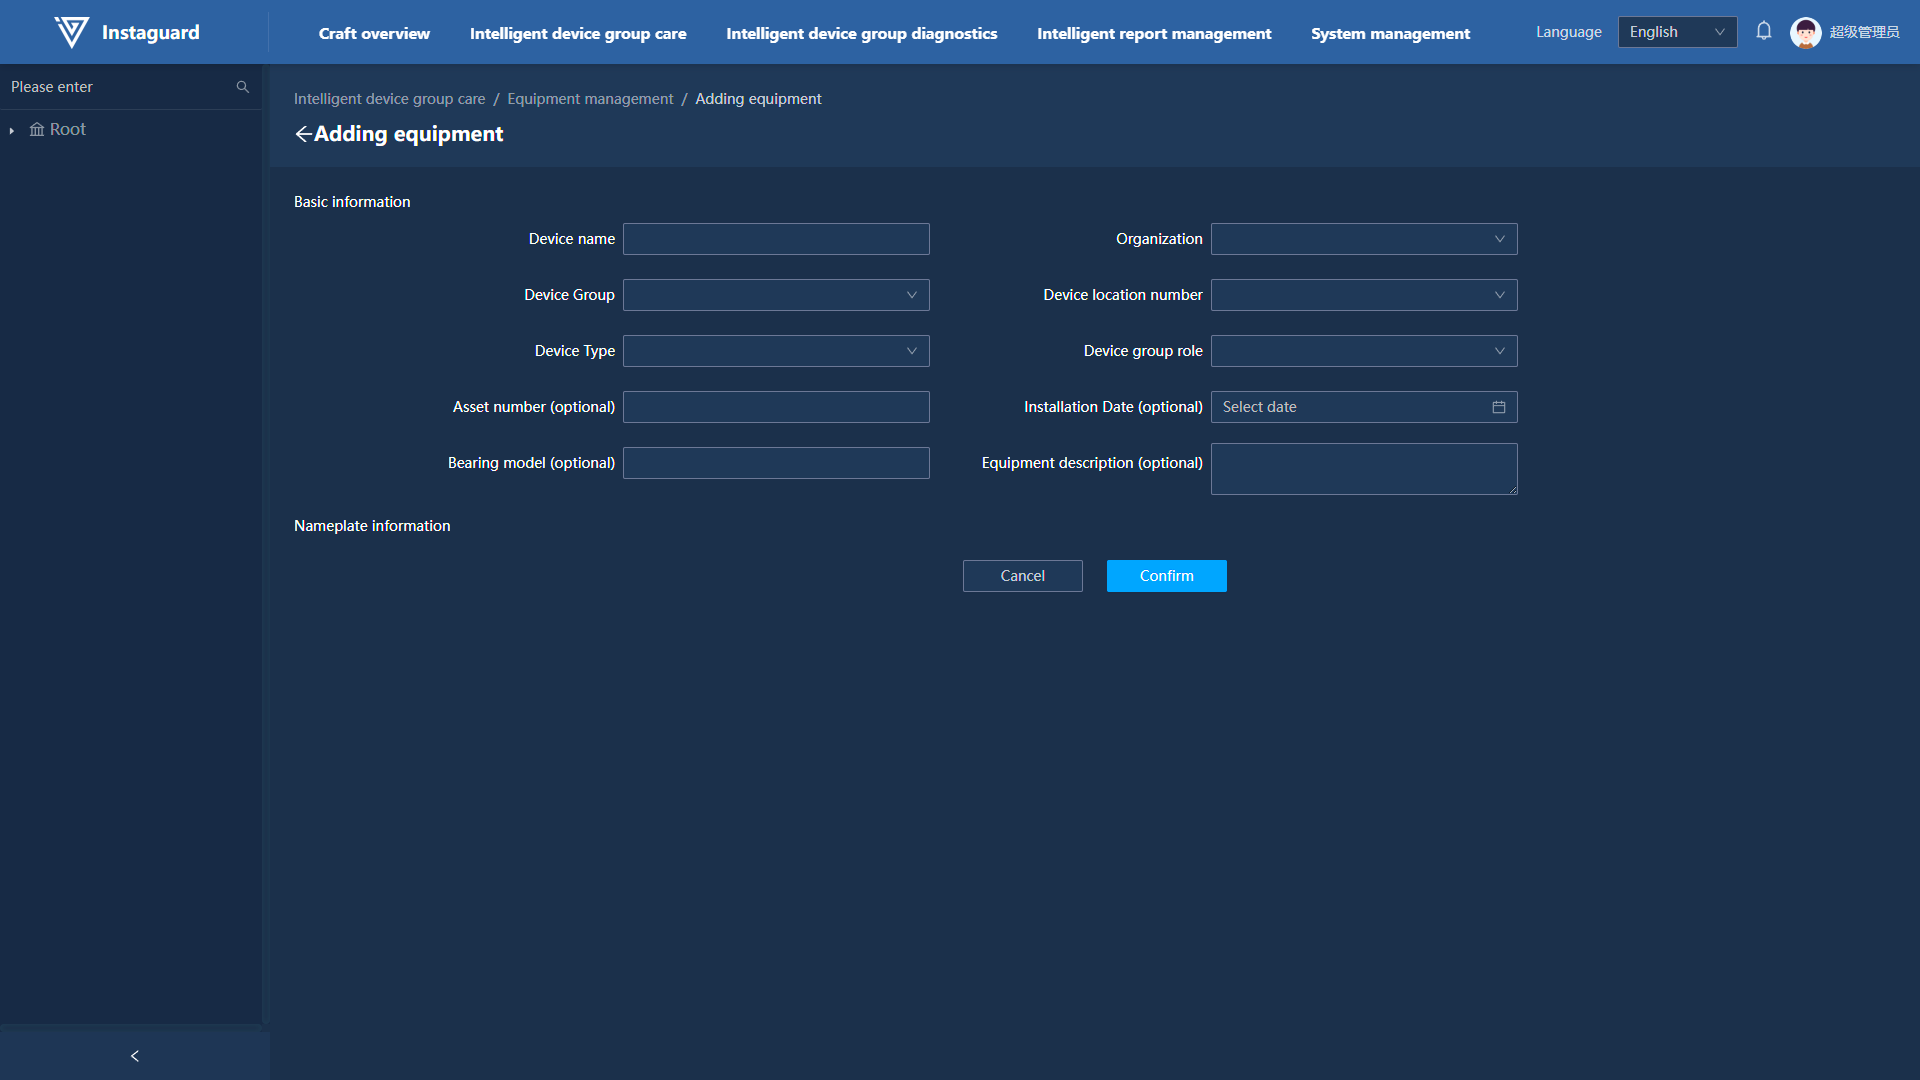
-
Selecting an organization auto-populates corresponding units. Selecting a device type displays required nameplate parameters below. Each unit position number can only correspond to one device.
-
Enter at least 3 characters of a bearing model to auto-display supported models (containing the keyword).
-
Multiple bearing models can be selected.
4.4 Editing Devices
In Device Management, click "Edit" for a specified device to open the editing page. The device's organization, unit name, position number, and type cannot be modified.
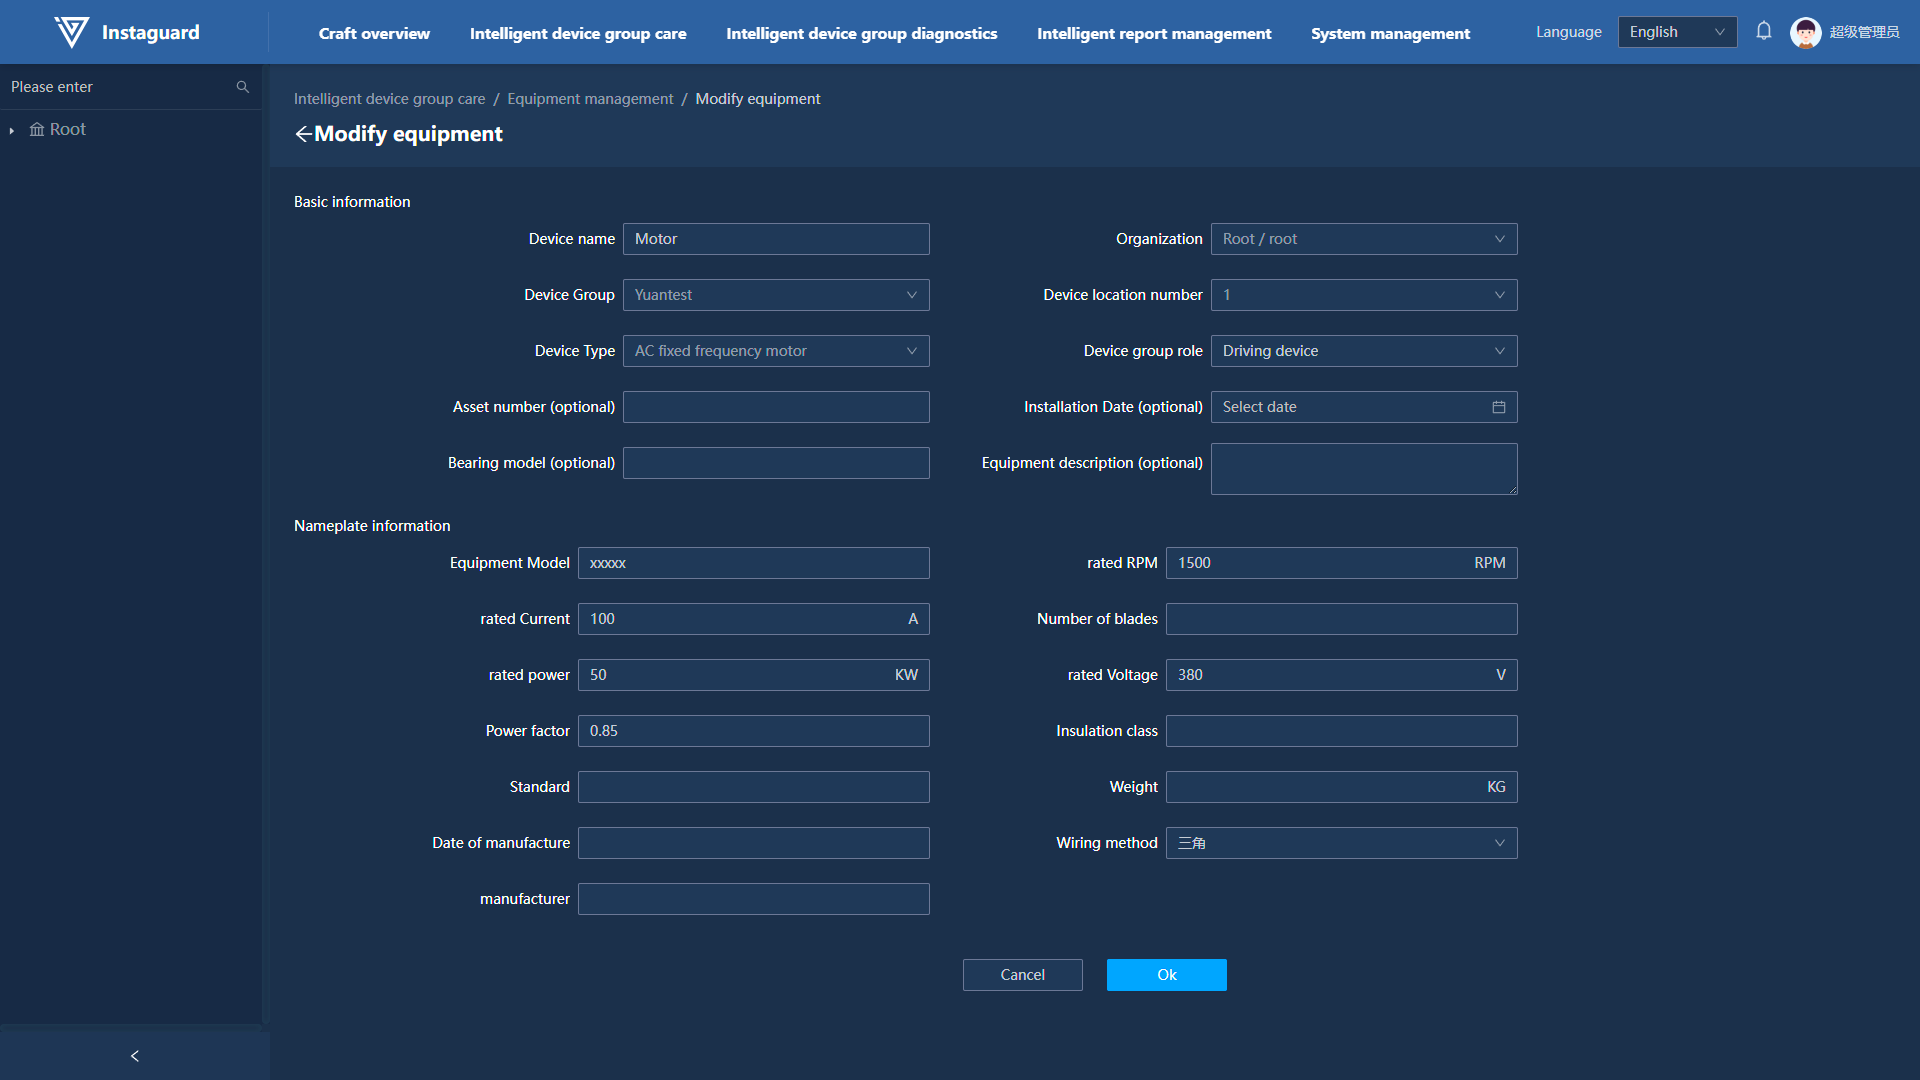
4.5 Device Details
In Unit Management, click "Details" for a specified device to display its detailed information on the right.
Intelligent Unit Diagnosis
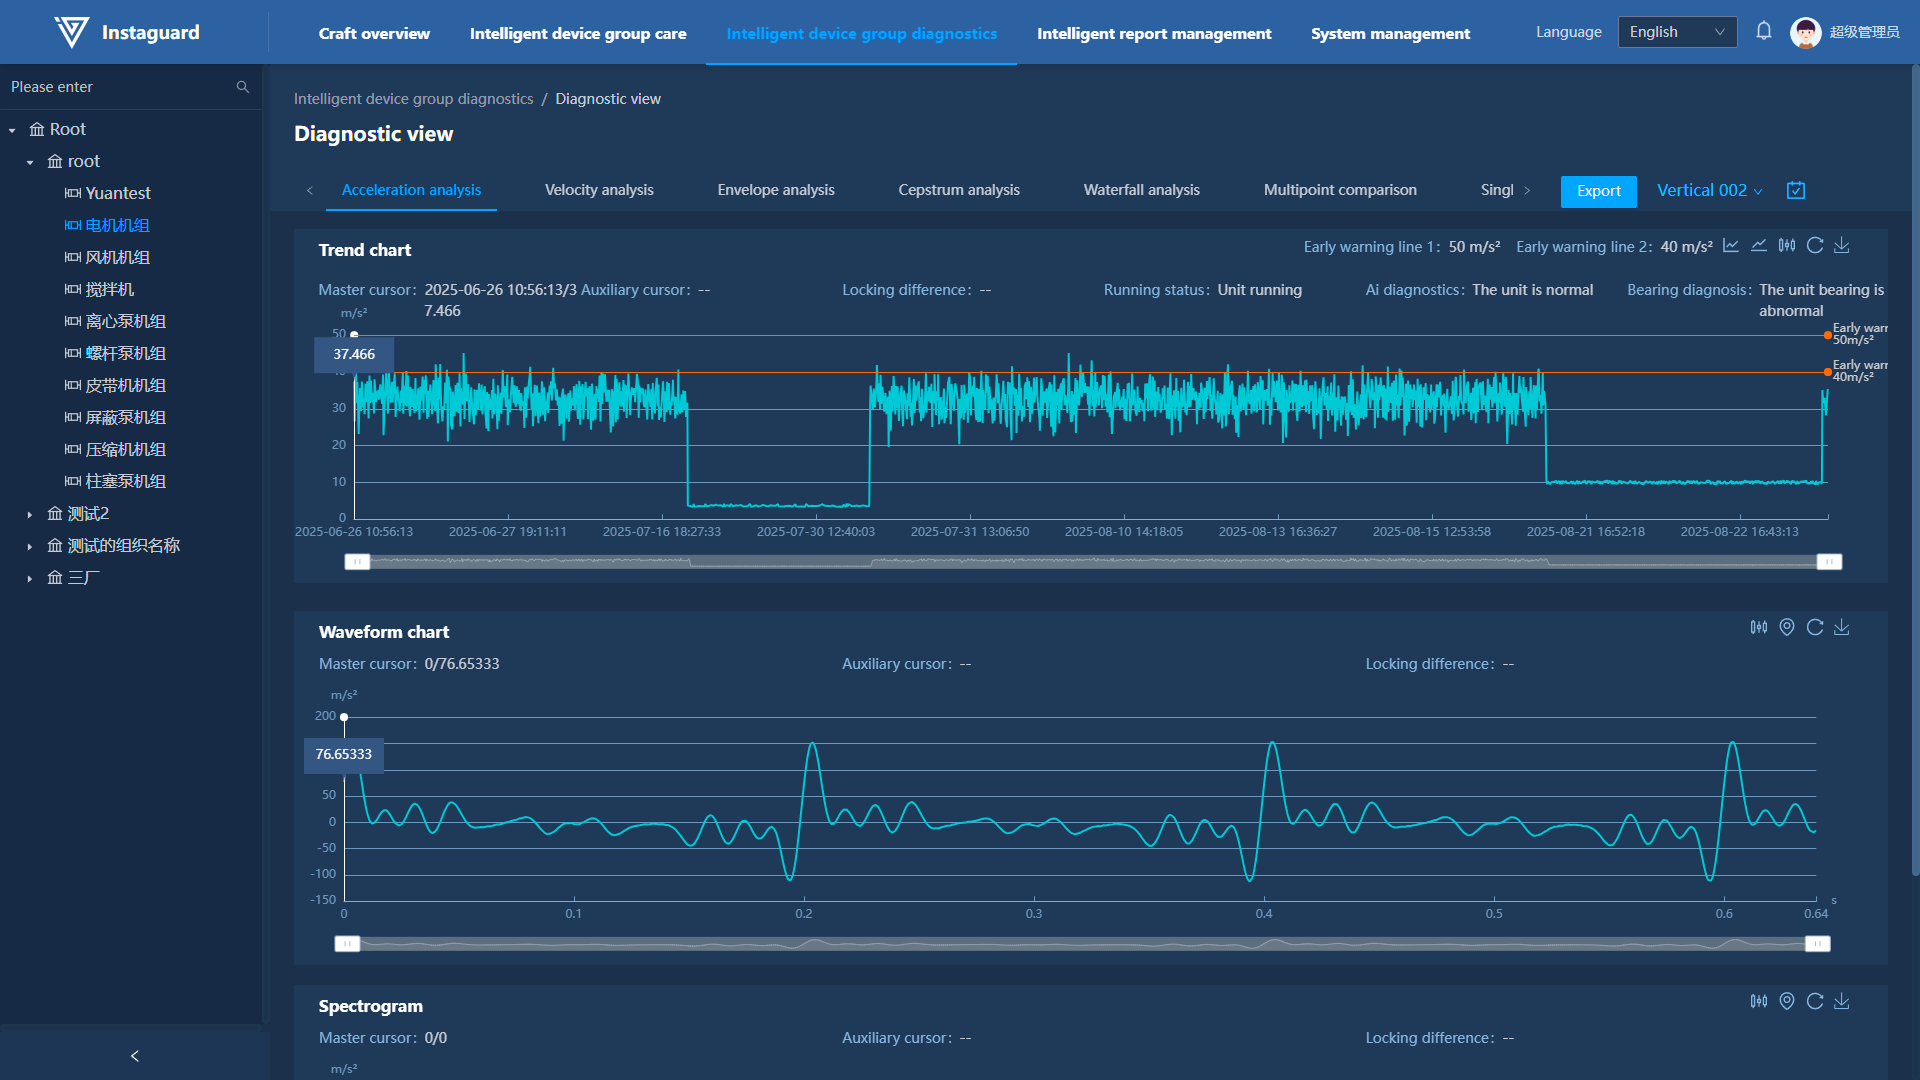
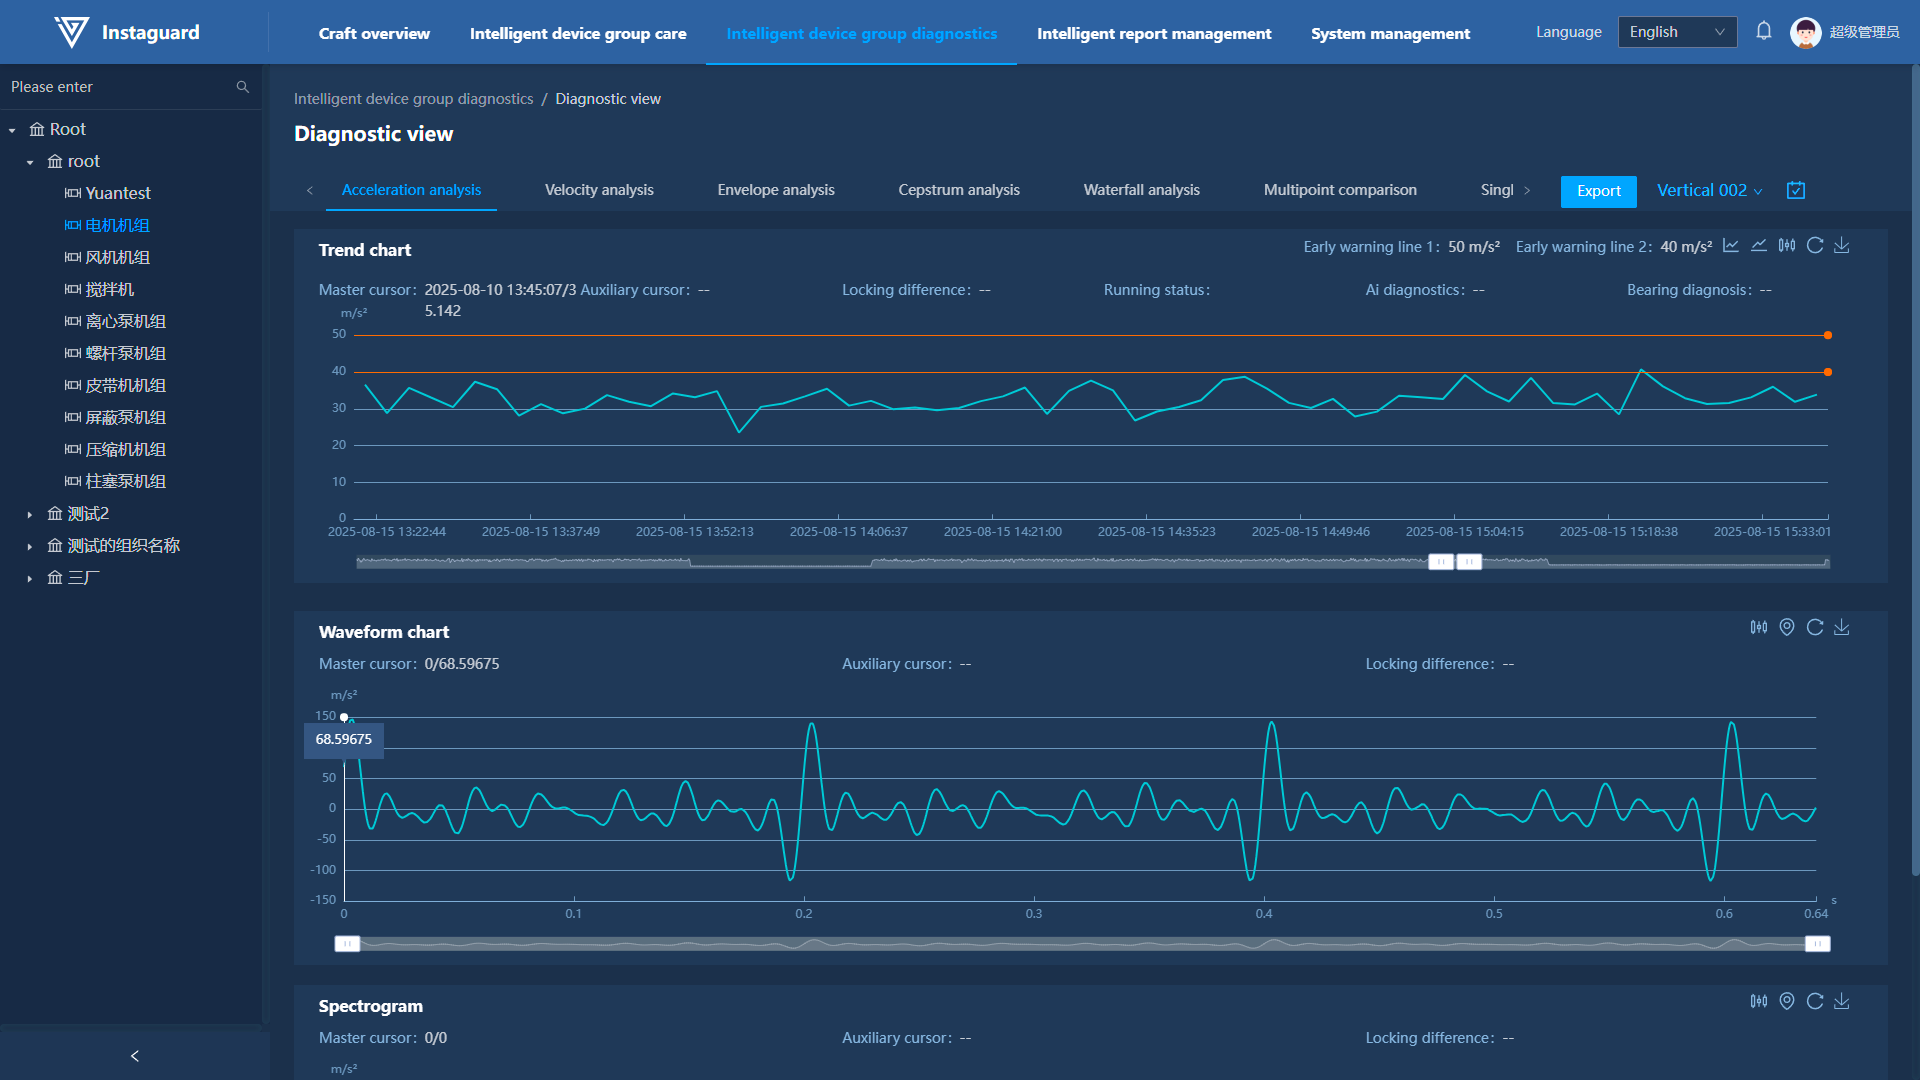
1. Diagnostic View
1.1 Navigation Path
「Intelligent Unit Diagnosis」 → 「Diagnostic View」
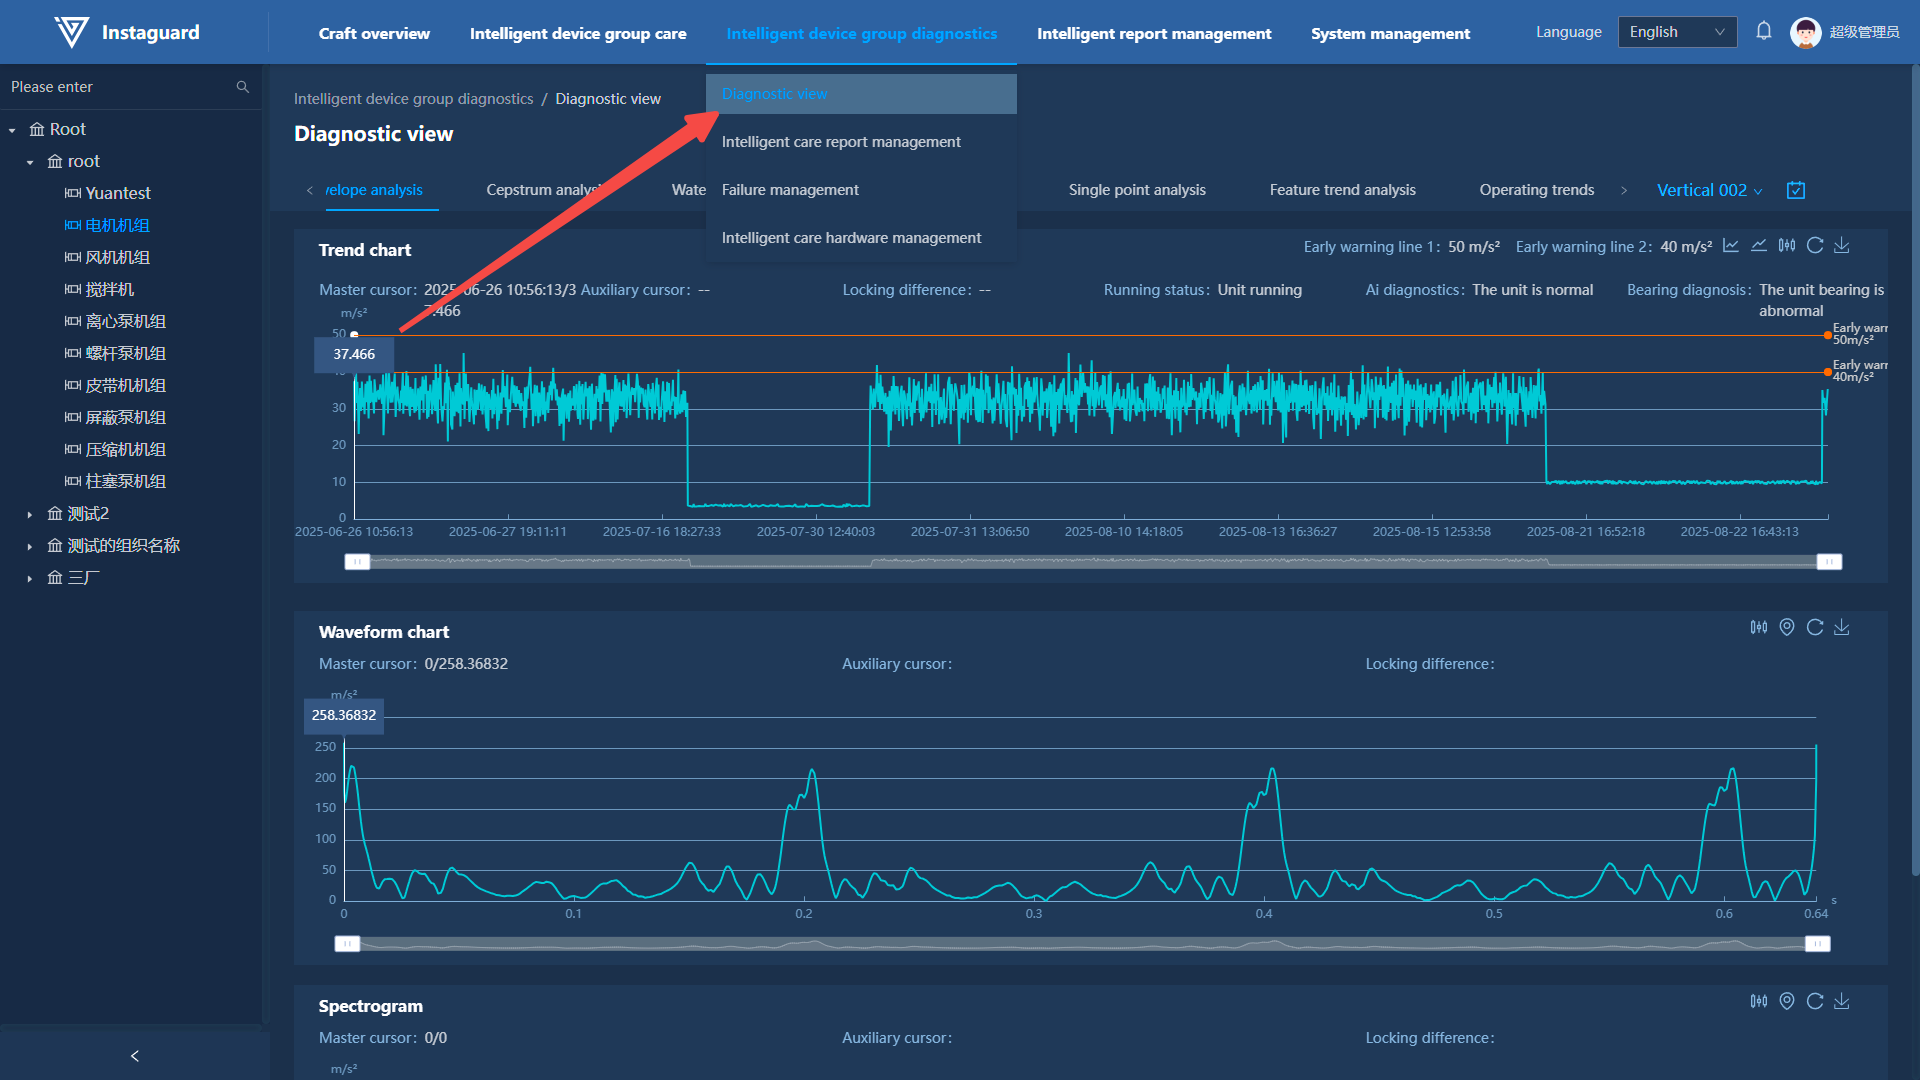
1.2 Function Overview
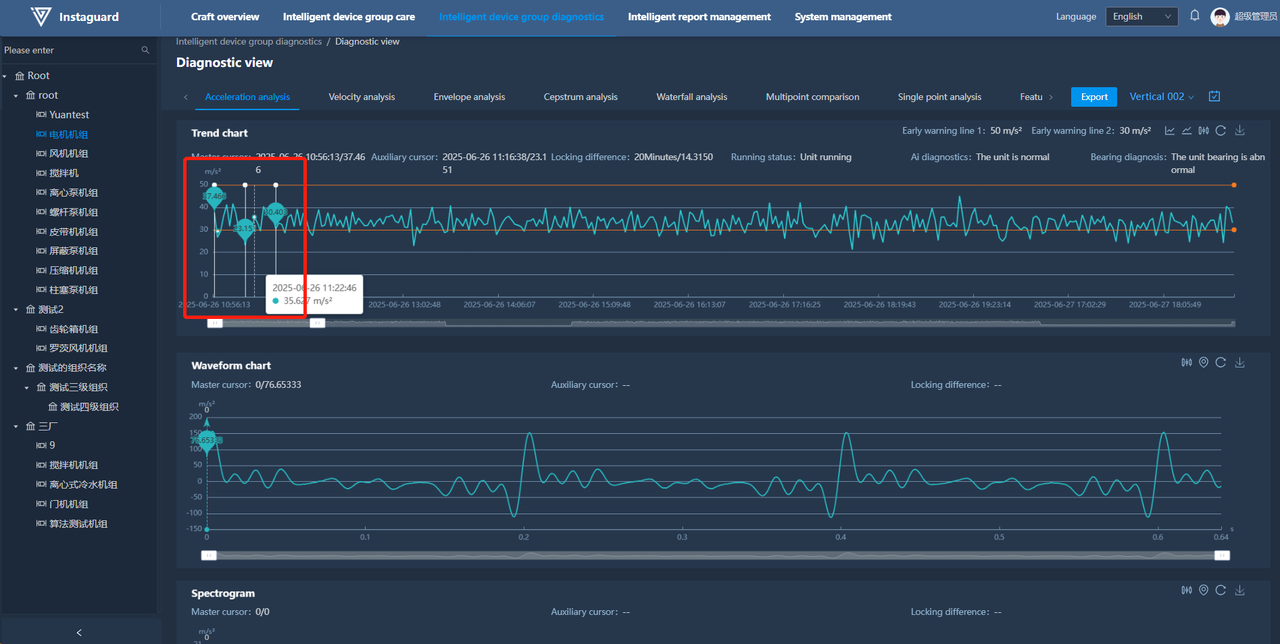
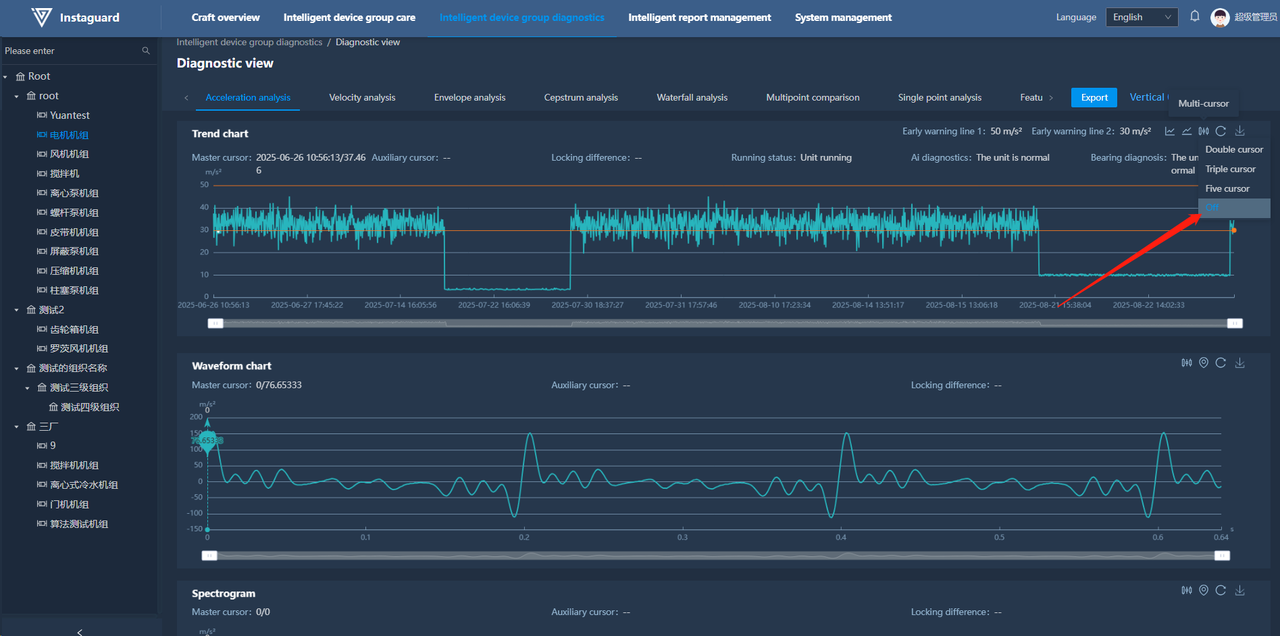
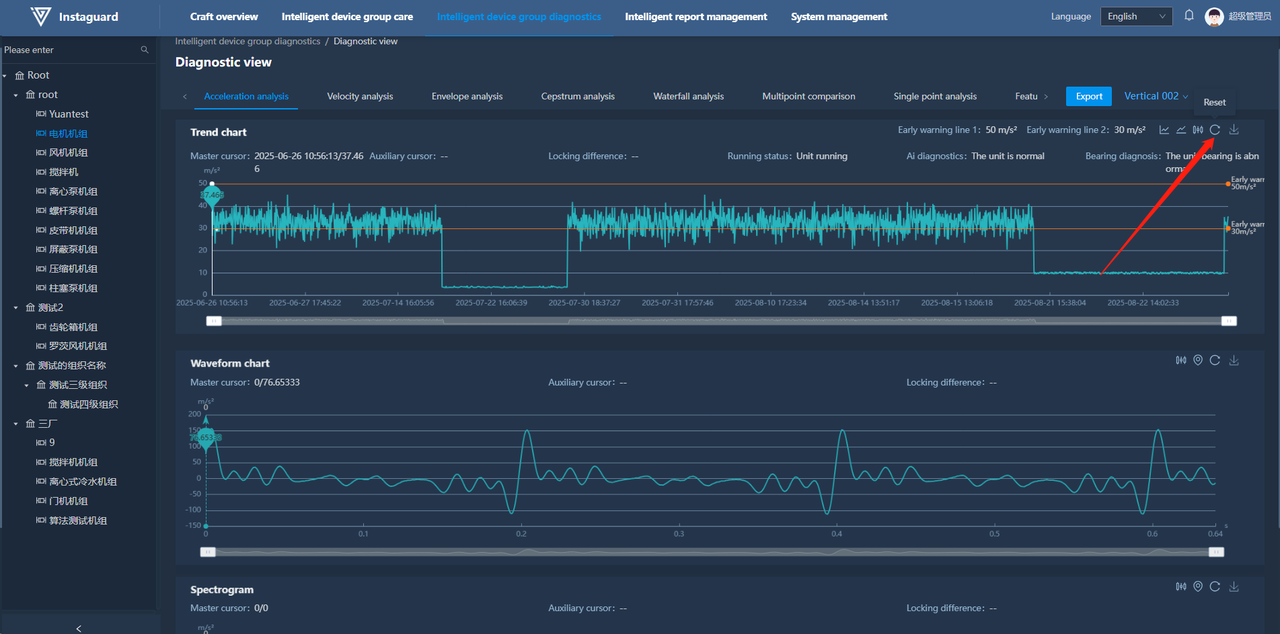
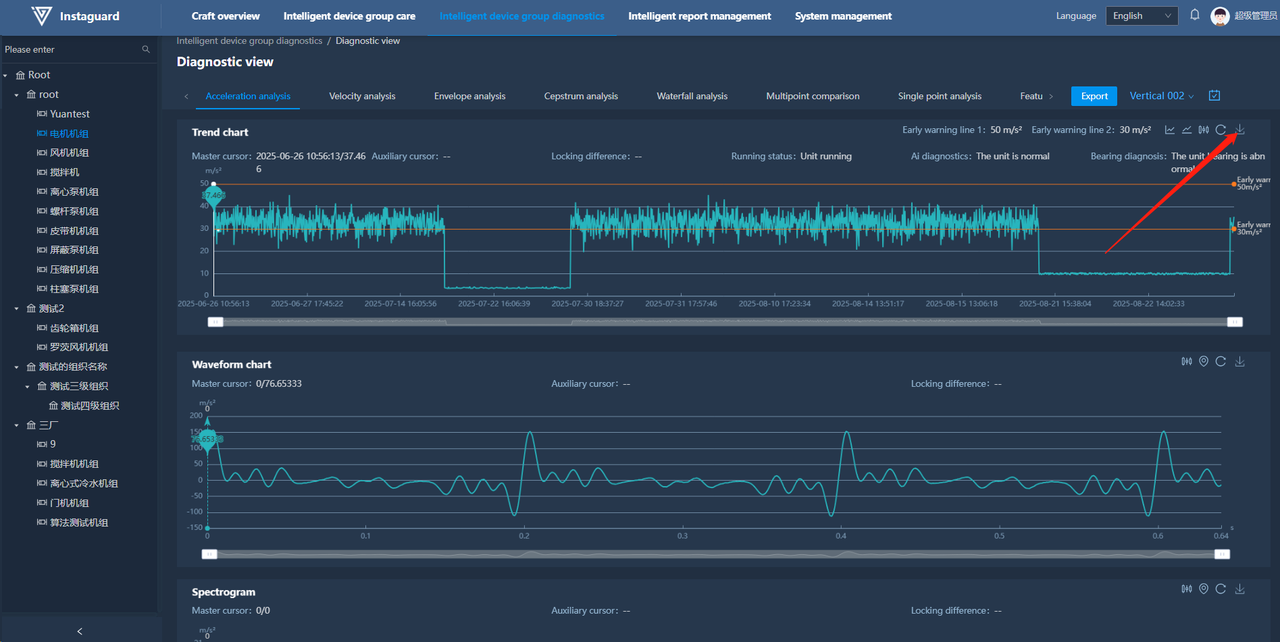
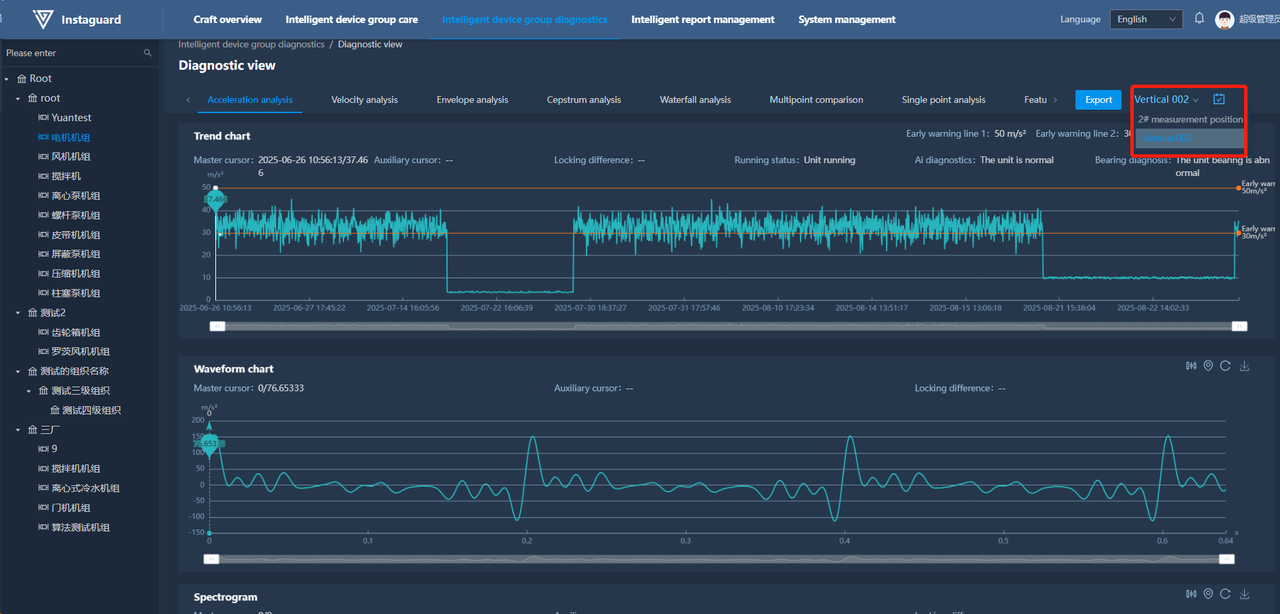
The intelligent diagnosis view enables users to perform data analysis on cared units. Diagnostic charts include acceleration view, velocity view, envelope view, cepstrum view, waterfall view, single-measuring-point comparison, multi-measuring-point comparison, characteristic trend analysis, and operation trend view. Views contain trend charts, waveform charts, and spectrum charts, supporting functions such as quick master cursor setting, multi-cursor viewing (2/3/5 cursors), main-auxiliary cursor difference viewing, and warning line display. Trend charts support showing/hiding trend points. Waveform and spectrum charts support multi-point annotation for easy data comparison. All charts support specified area zooming and quick positioning.
1.3 Waveform and Spectrum Display
By default, the first measuring point data of the first unit in the user's governing organization for the past 7 days are displayed. Left-click a data point in the trend chart to show corresponding waveform and spectrum information below.
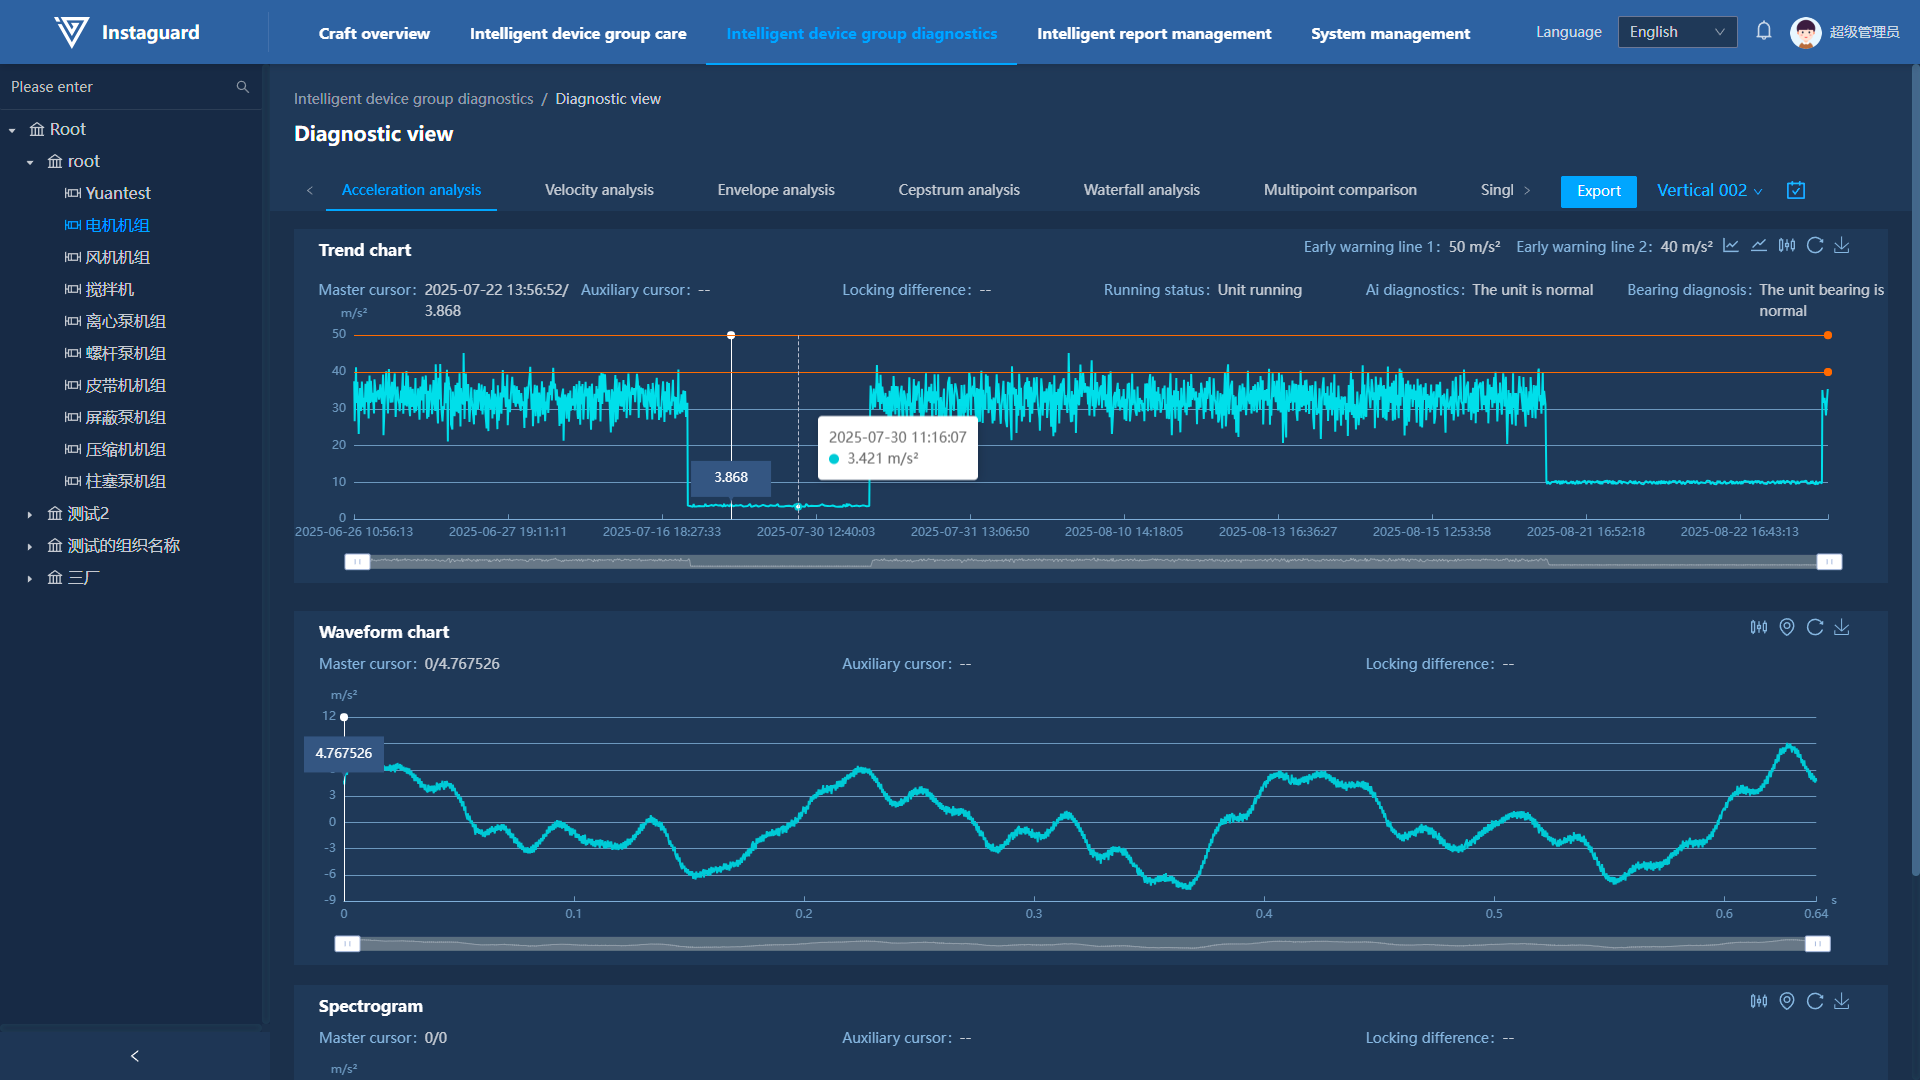
- The trend chart cursor displays information of the clicked trend point.
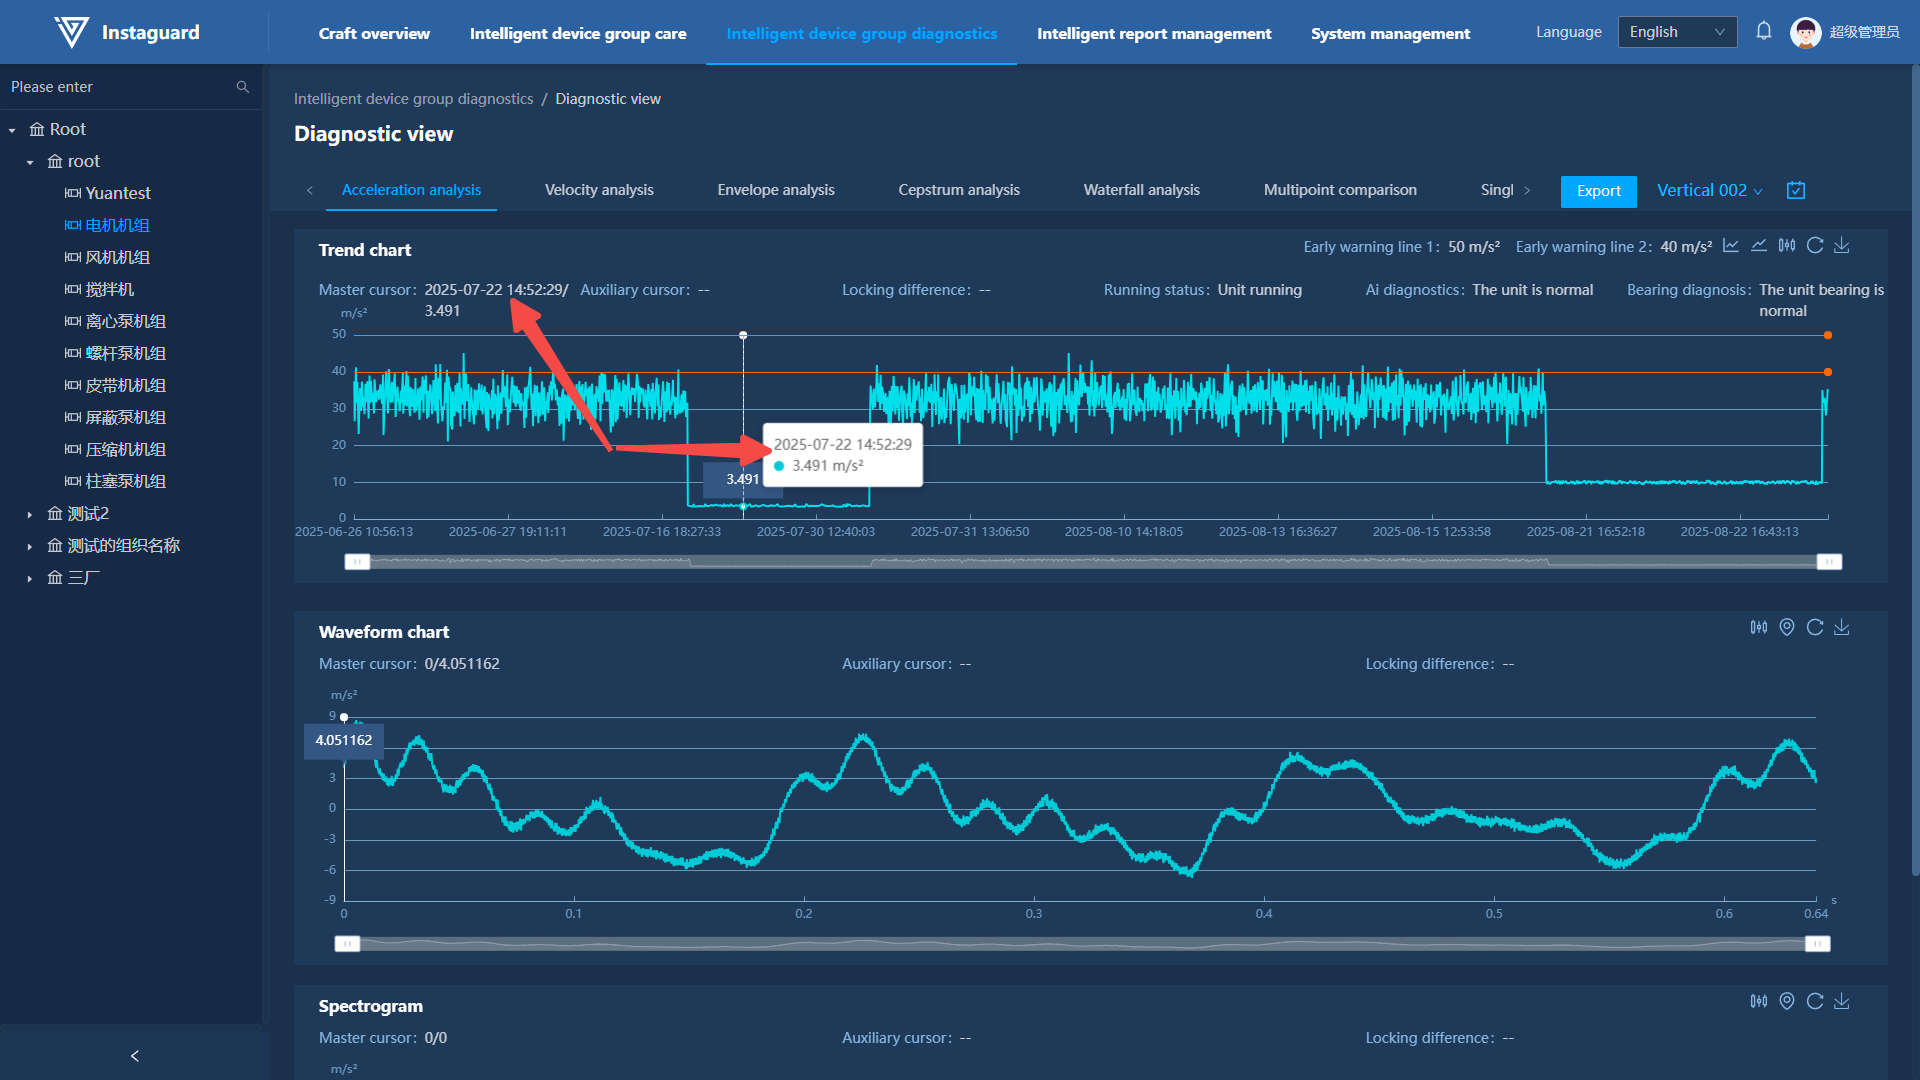
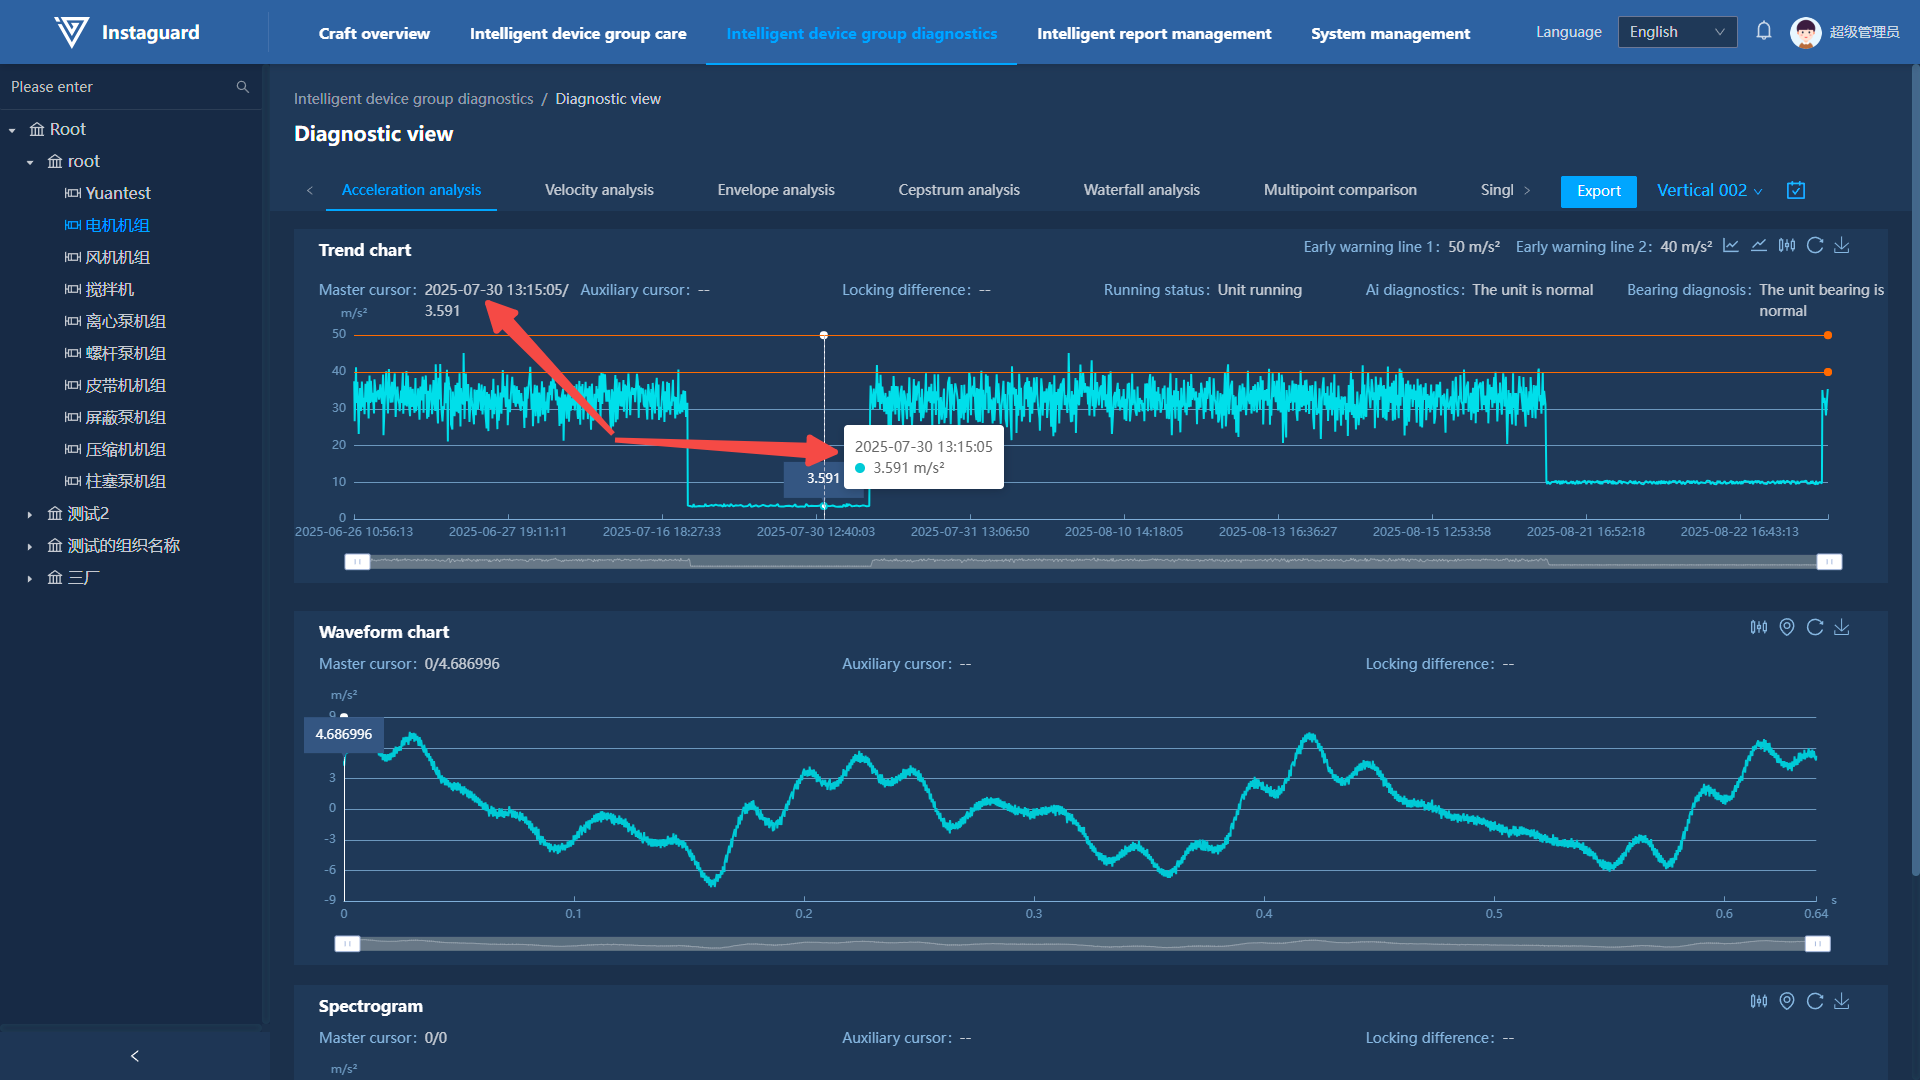
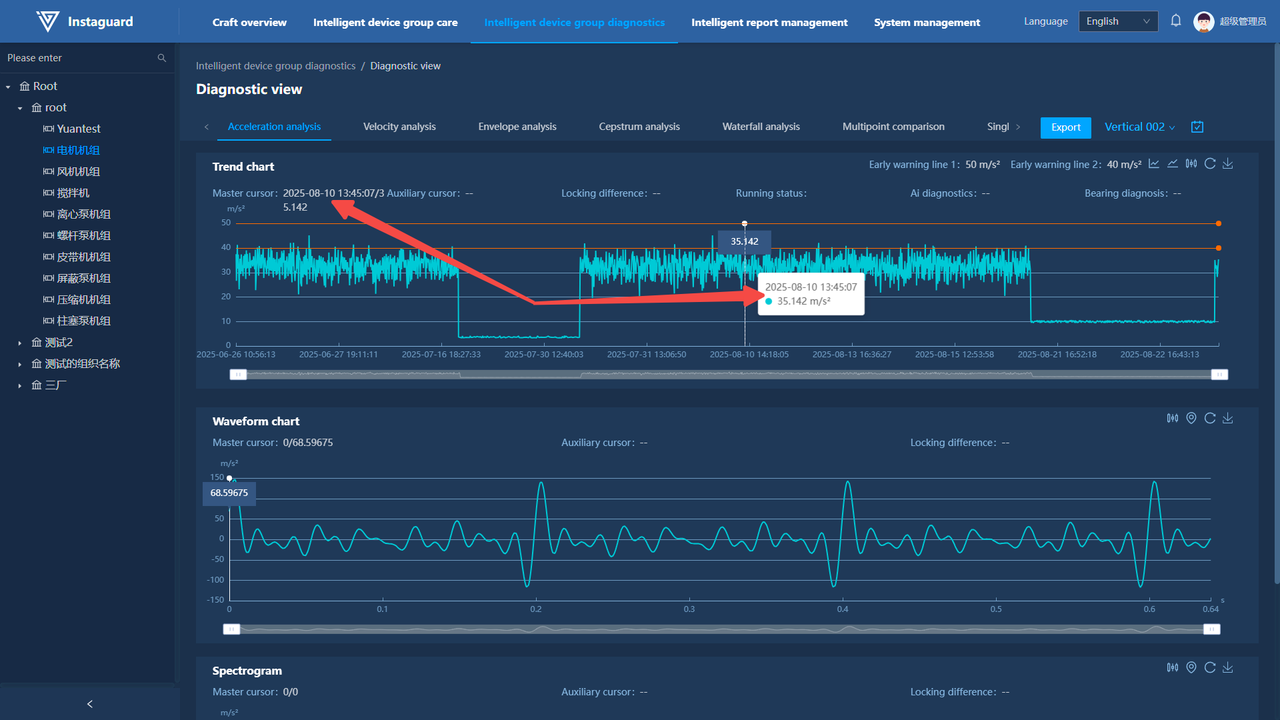
1.4 Master Cursor Switching
Click a data point in the chart to switch the master cursor, which will display information of the latest selected point.
1.5 Trend Chart Point Display
Click the "Point Display" button at the upper-right of the trend chart to show/hide trend points.
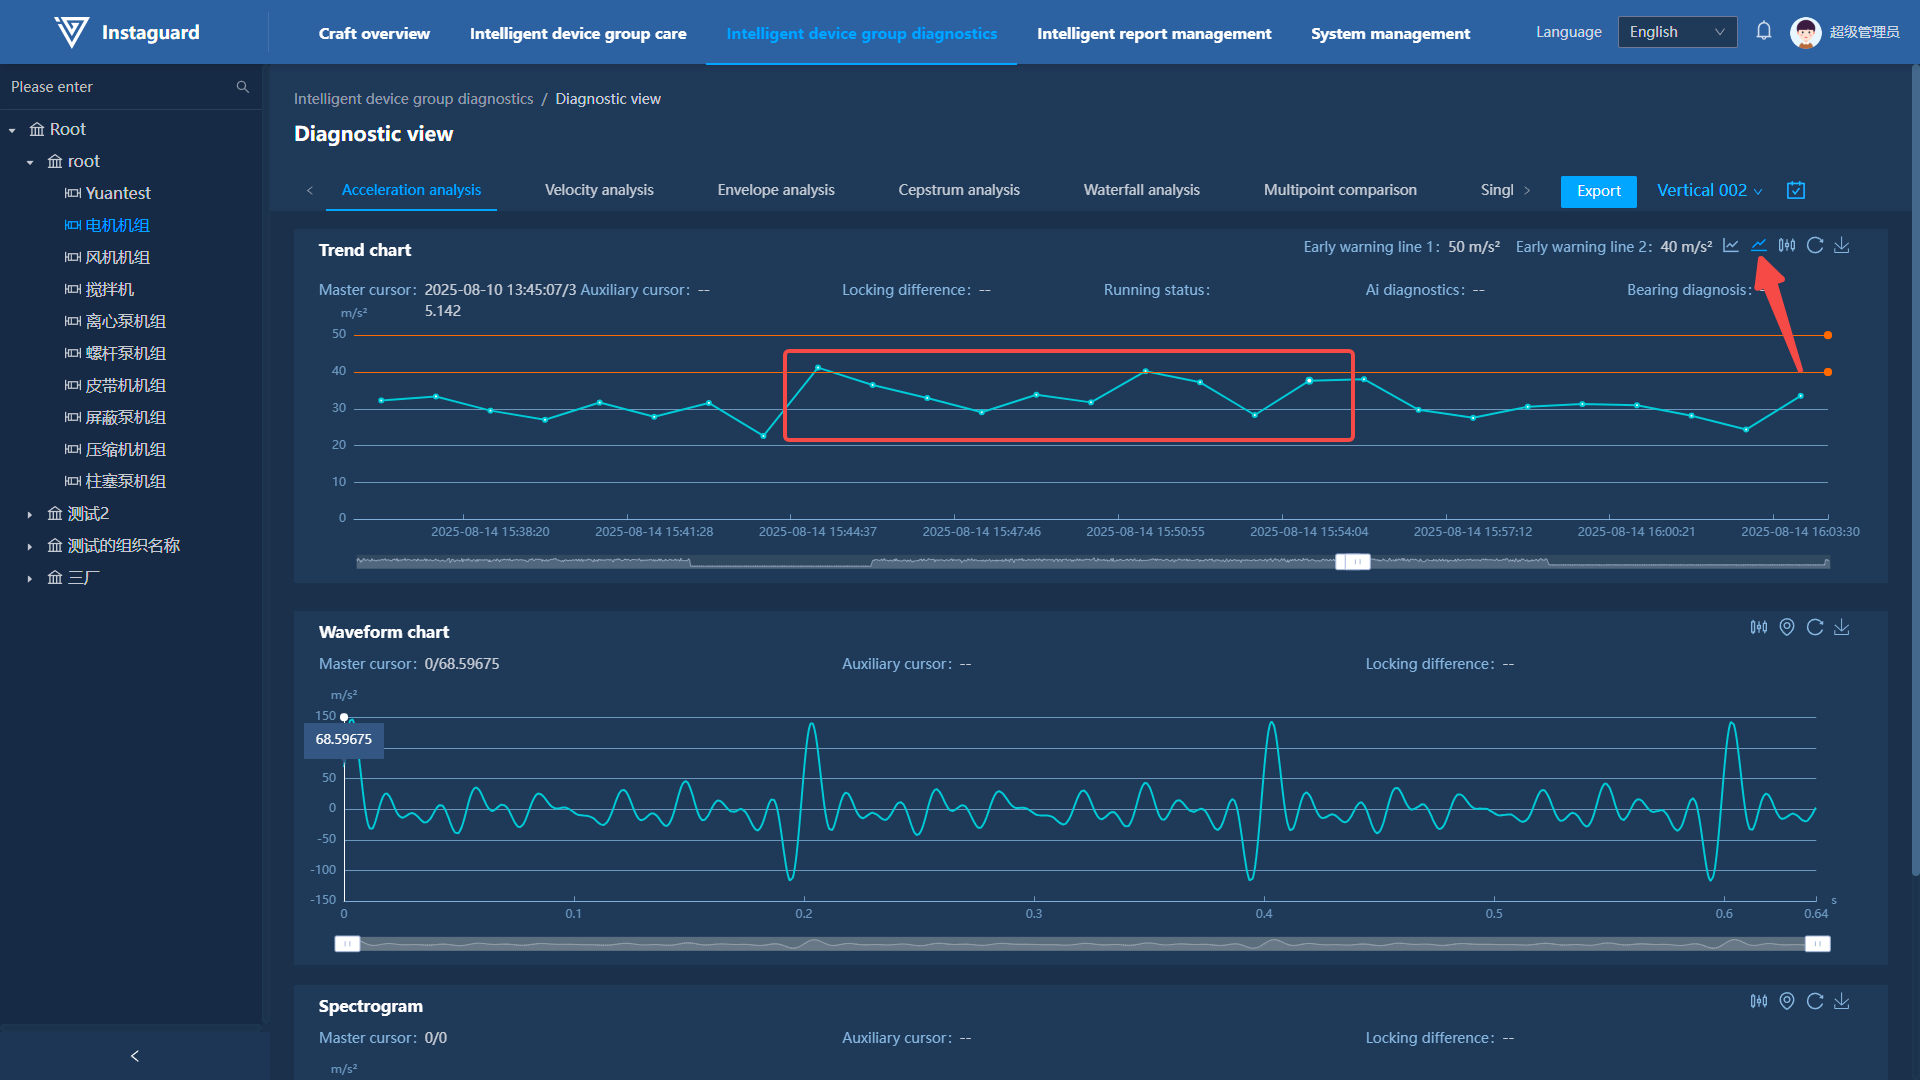
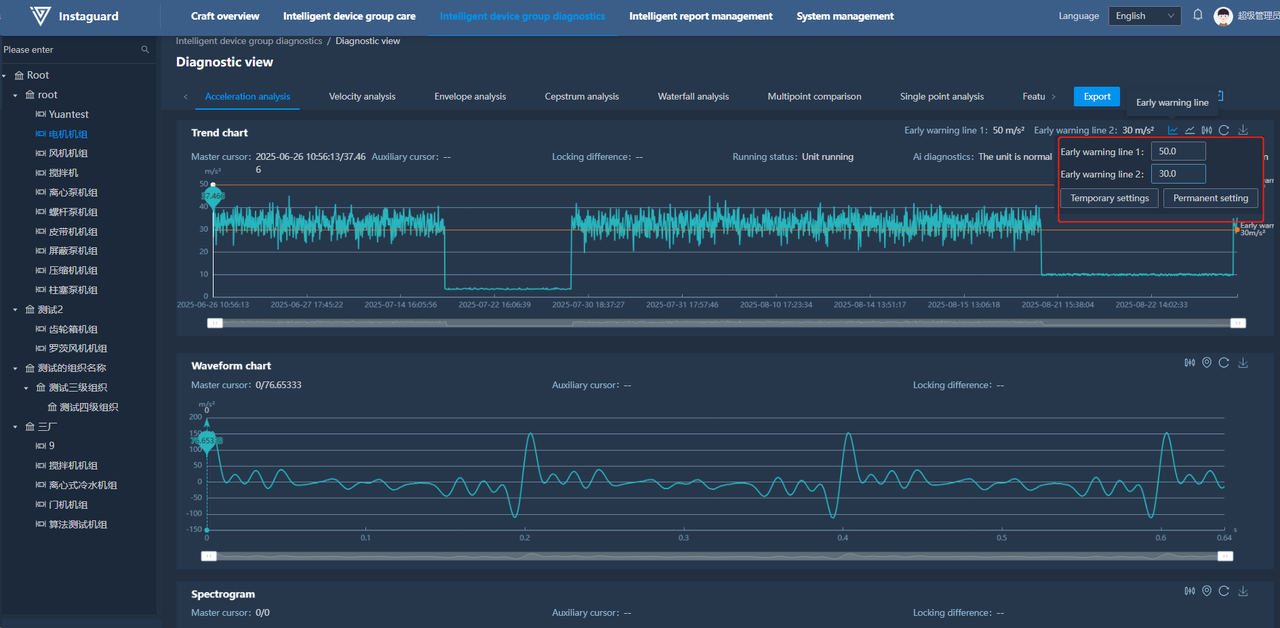
1.6 Warning Line Display
Click the "Warning Line Display" button at the upper-right of the trend chart to show/hide warning lines.
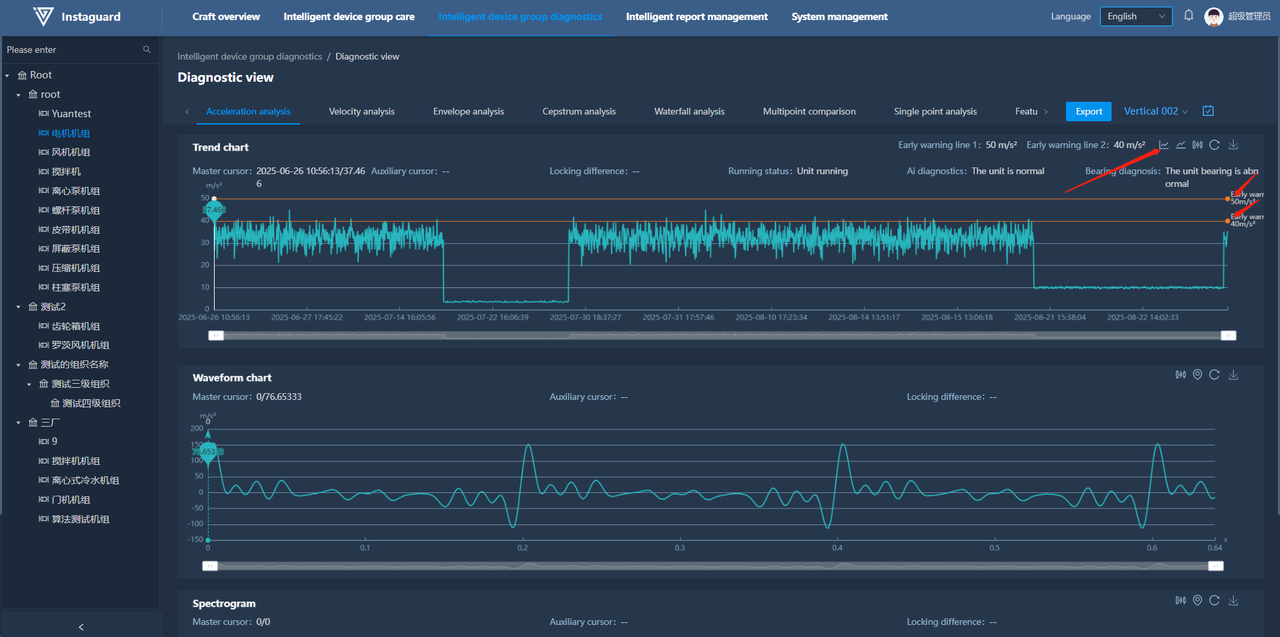
- Manually enter warning line values or use buttons to adjust their position on the trend chart.
1.7 Auxiliary Cursor Display
Click the "Auxiliary Cursor Display" button at the upper-right of the chart, then select the number of cursors.
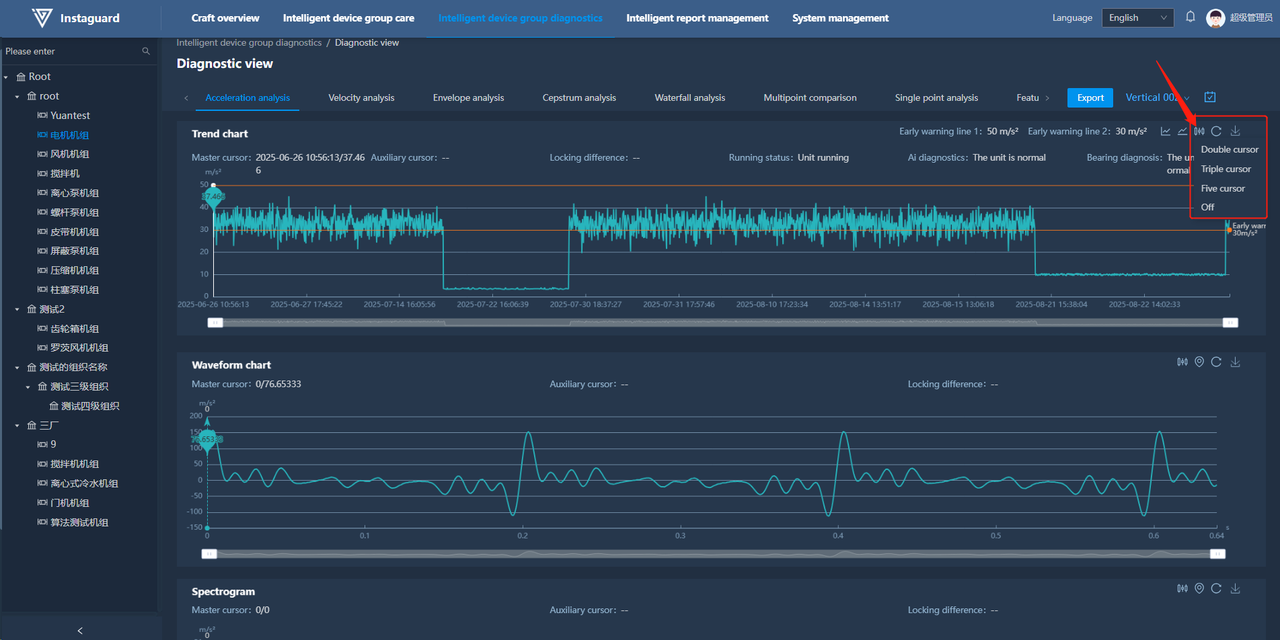
-
After selecting the cursor number, right-click a data point to add the second cursor (additional cursors are auto-placed based on the interval between the master and second cursor). The auxiliary cursor shows the second cursor's value, and the locked difference is the value between the master and second cursor.
-
Click "Close" in the auxiliary cursor display menu to hide all cursors and clear auxiliary cursor information.
1.8 Clear
Click the "Clear" button at the upper-right of the chart to restore the default display.
1.9 Chart Download
Click the "Download" button at the upper-right of the chart to save the chart as a PNG image locally.
1.10 Measuring Point Switching
Click the measuring point drop-down list at the right of "View Switching" to switch to a specified measuring point.
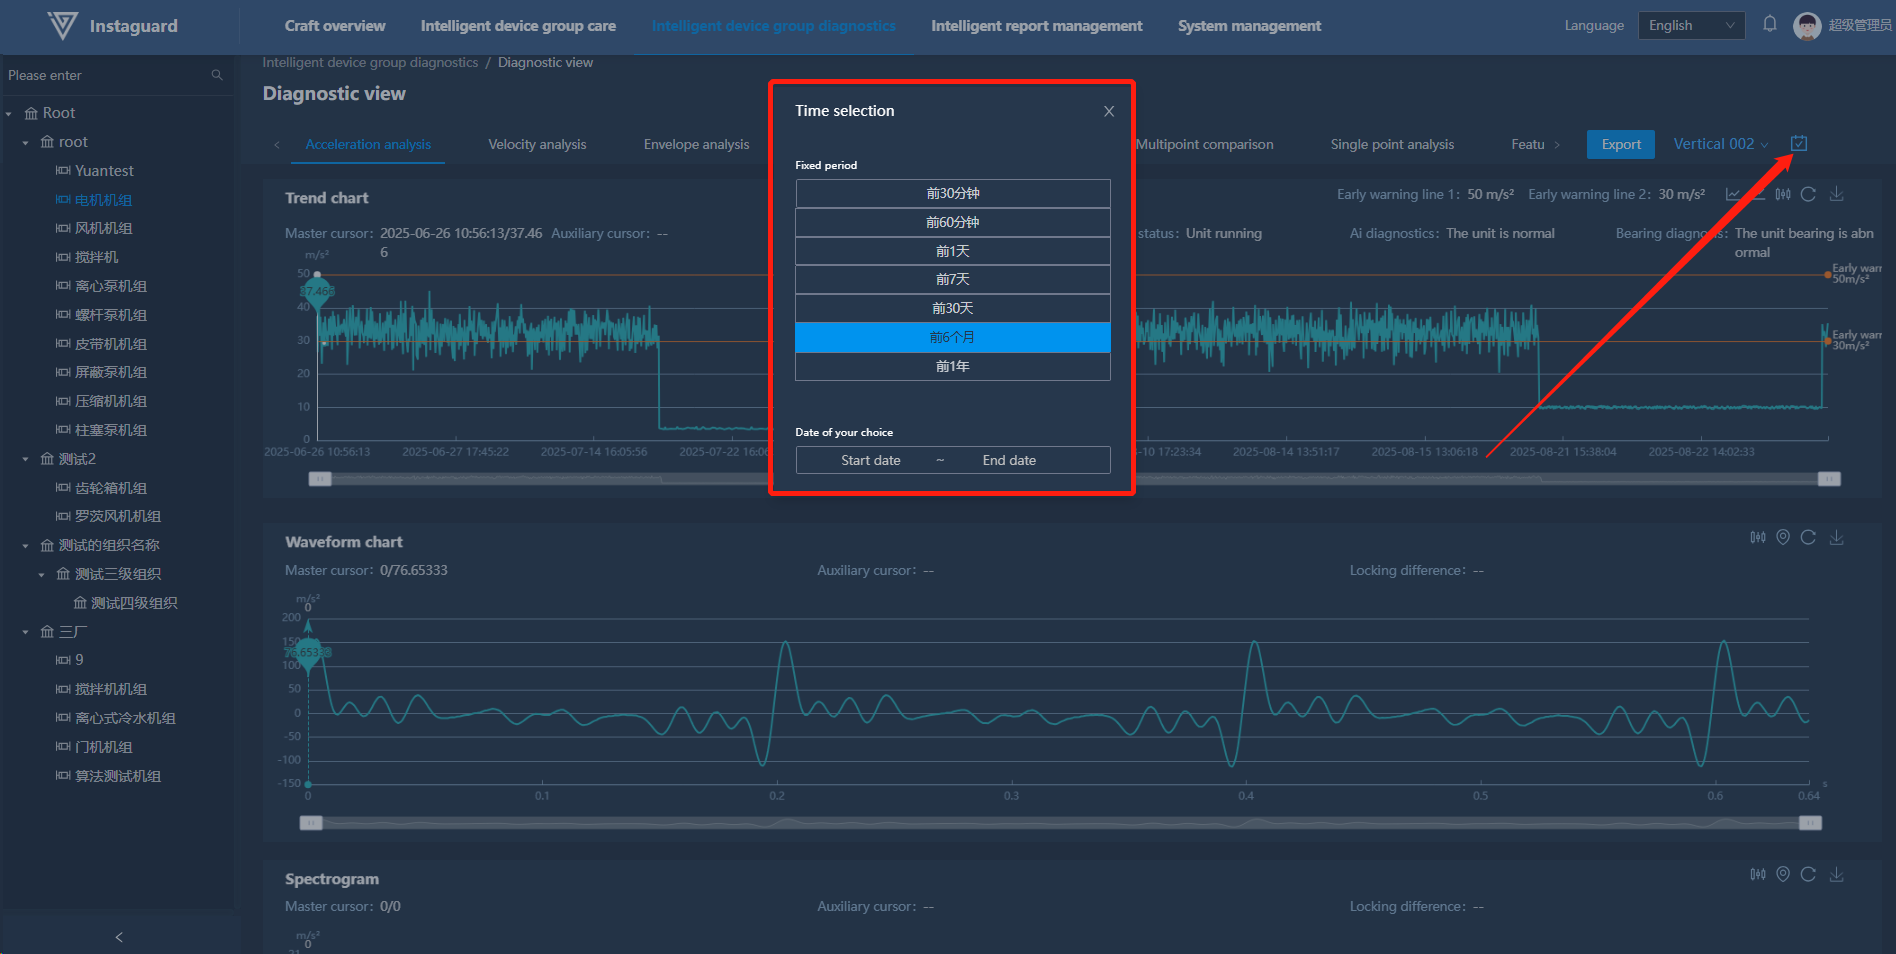
1.11 Time Selection
Click the "Time Selection" button at the right of "View Switching" to open the time selection page.
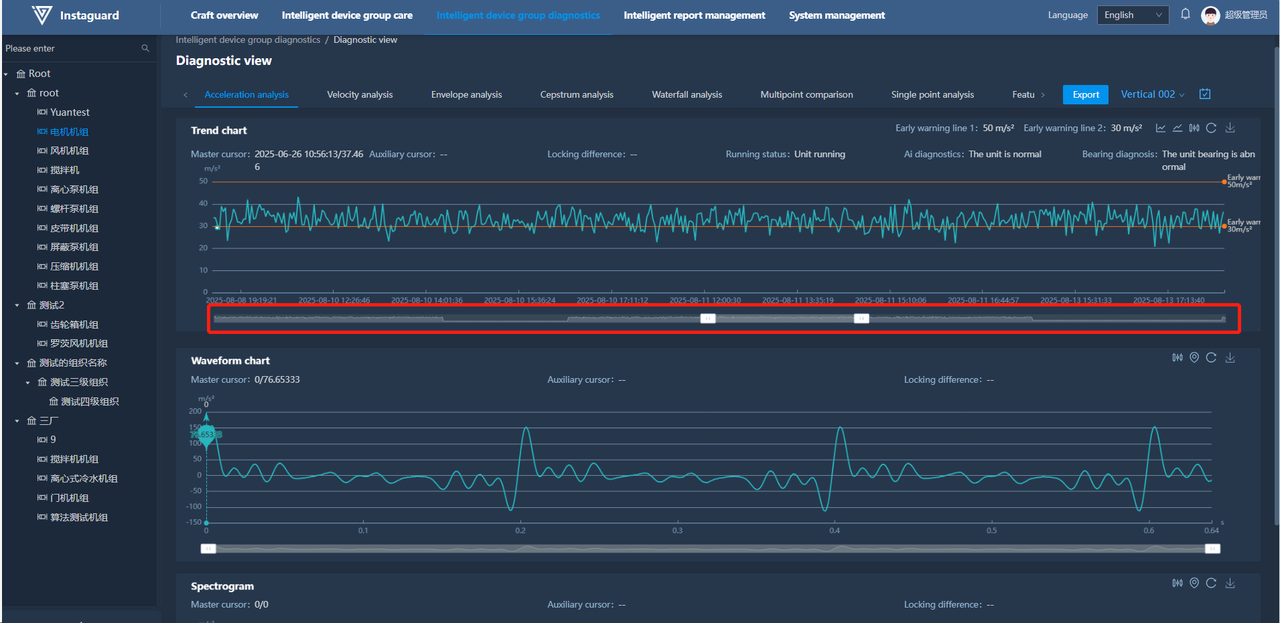
1.12 Chart Zooming
Use the mouse wheel to zoom in/out on the chart, or use the zoom bar below the chart to adjust scale and pan left/right.
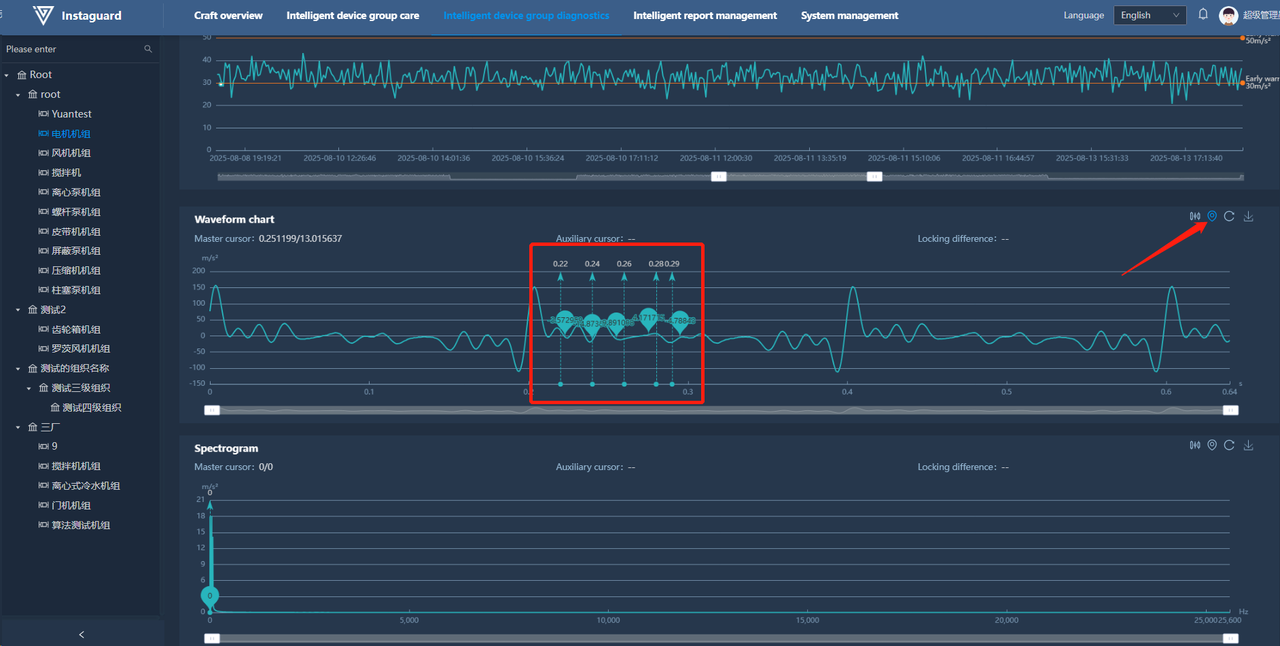
1.13 Multi-point Annotation
Enable multi-point annotation on waveform and spectrum charts by clicking the annotation button. Use Ctrl+left-click to annotate points (up to 5 points, displaying specific values).
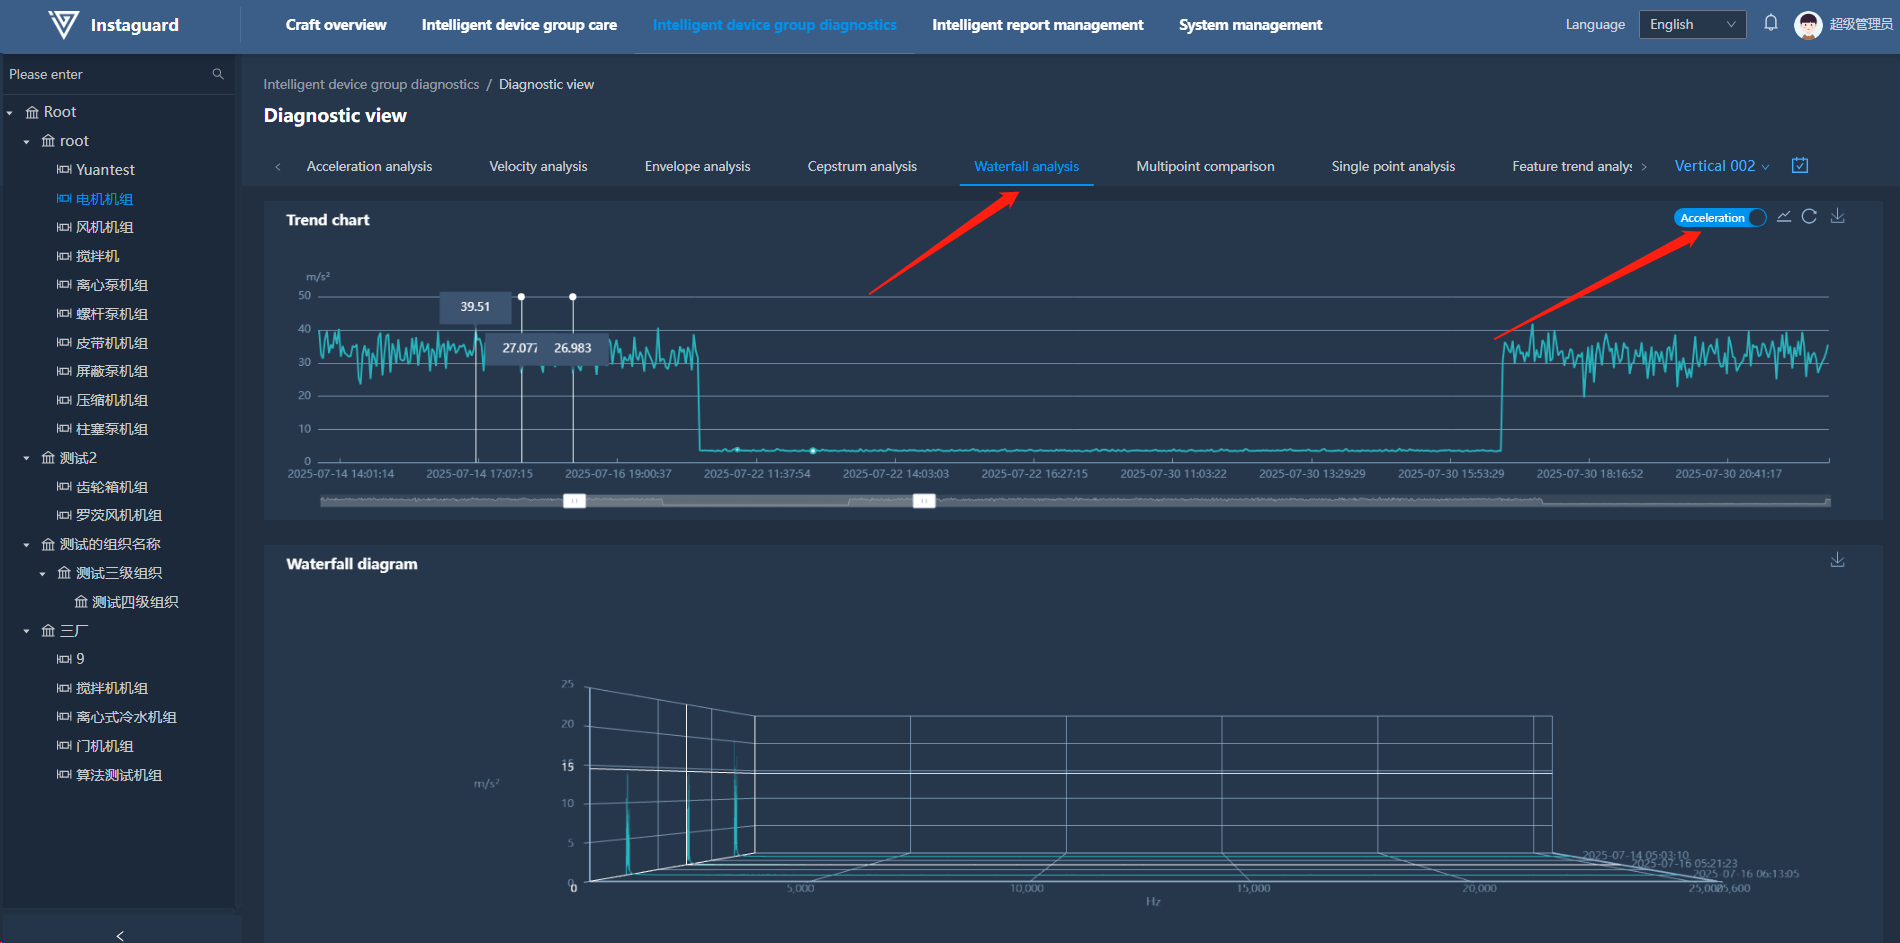
1.14 Waterfall View
Click "Waterfall Analysis" to jump to the waterfall view. Use the slider to switch data display types and Ctrl+left-click to select points (up to 5).
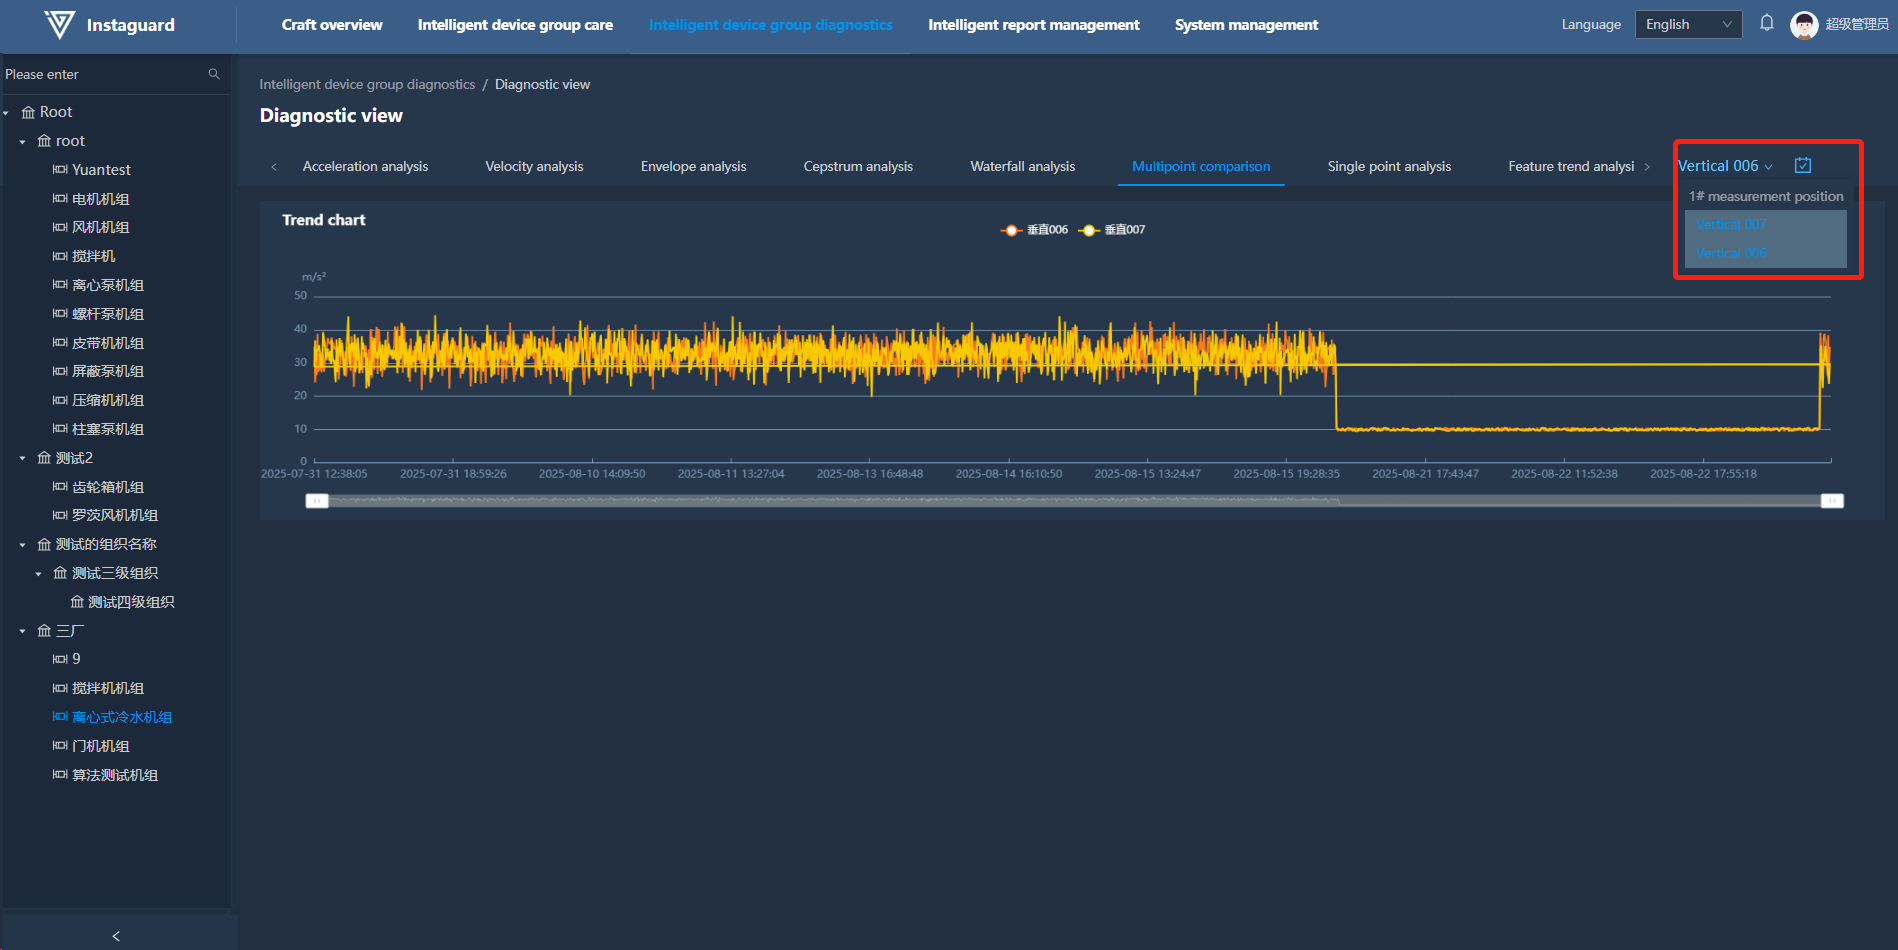
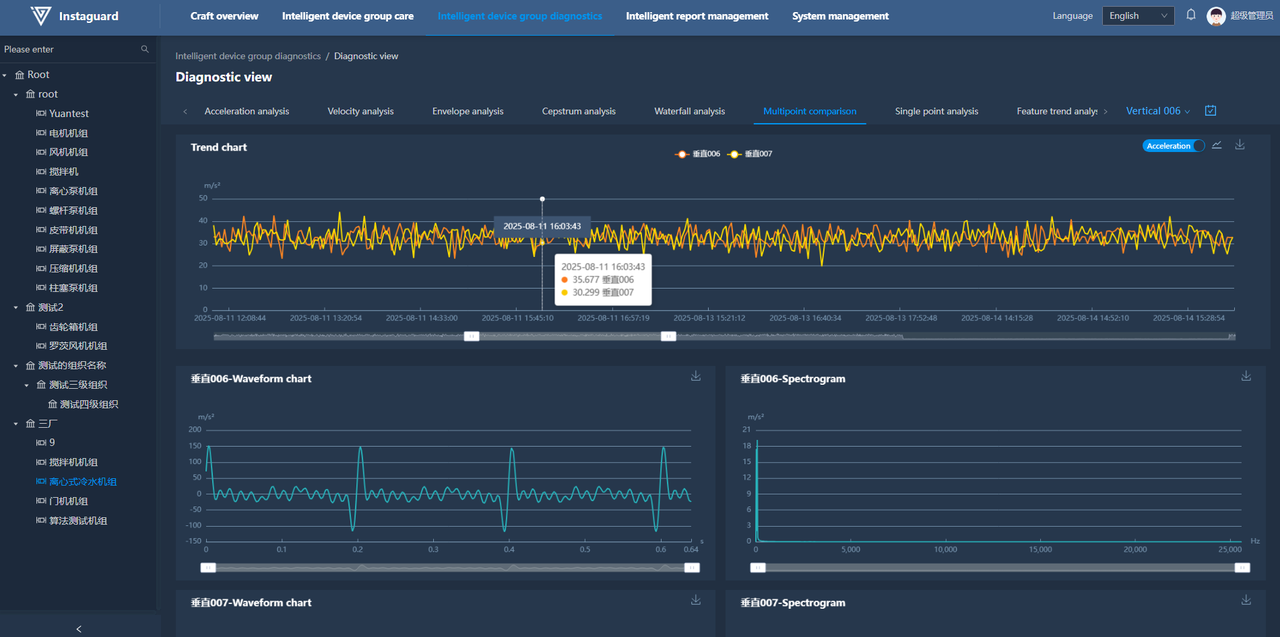
1.15 Multi-measuring-point Comparison
Click "Multi-measuring-point Comparison" to jump to the comparison view. Use the slider to switch display types, select measuring points in the drop-down list (up to 5), and view trend data. Click a trend point to show corresponding waveforms/spectra below.
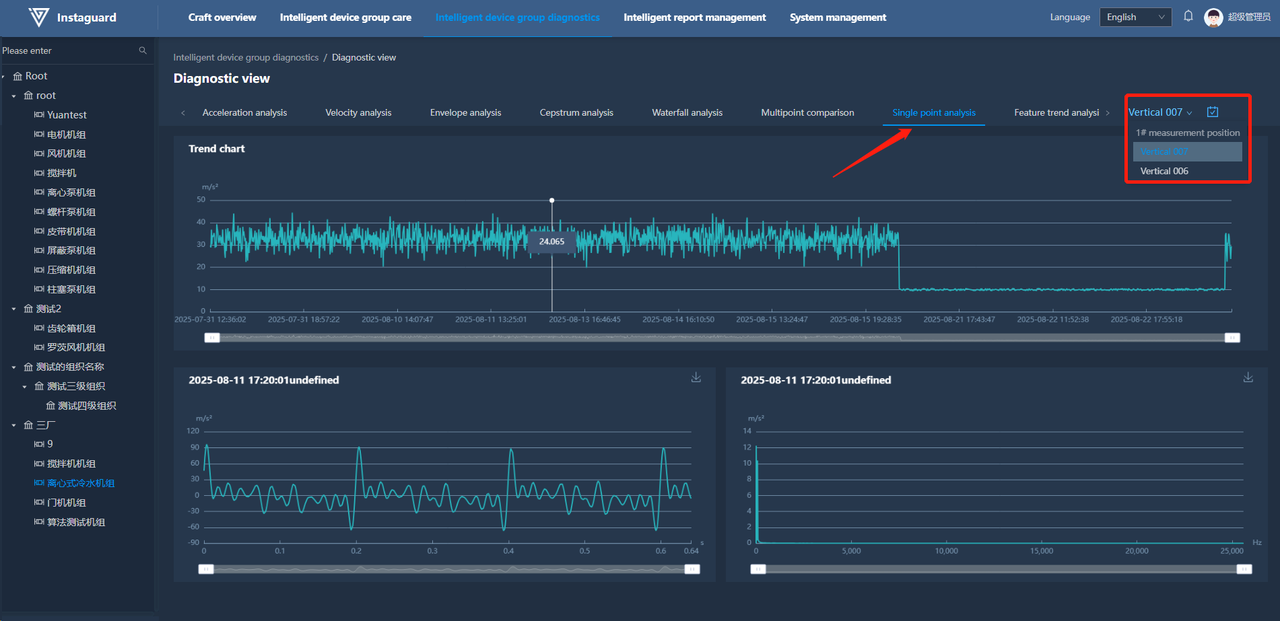
1.16 Single-measuring-point Comparison
Click "Single-measuring-point Analysis" to jump to the analysis view. Use the slider to switch display types and Ctrl+left-click to select points (up to 5), with clicked time points shown below.
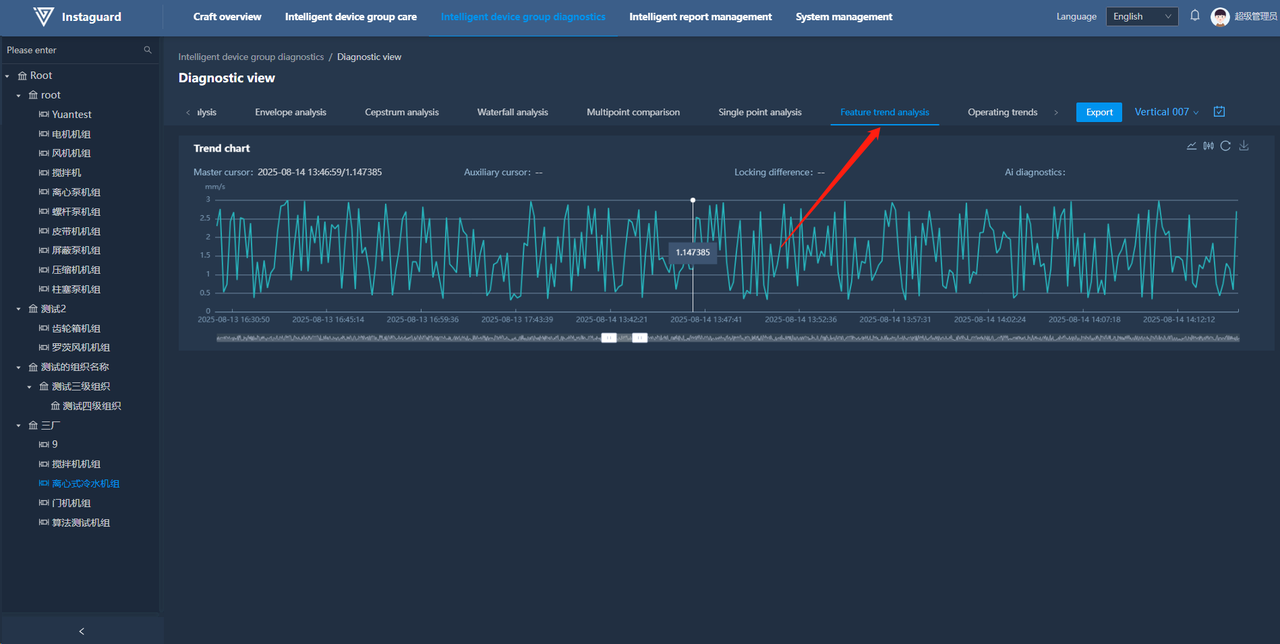
1.17 Characteristic Trend Analysis
Click "Characteristic Trend Analysis" to jump to the analysis view. Switch between characteristic trend displays via the measuring point drop-down list, with clicked time points shown below.
2. Intelligent Care Report Management
2.1 Navigation Path
「Intelligent Unit Diagnosis」 → 「Intelligent Care Report Management」
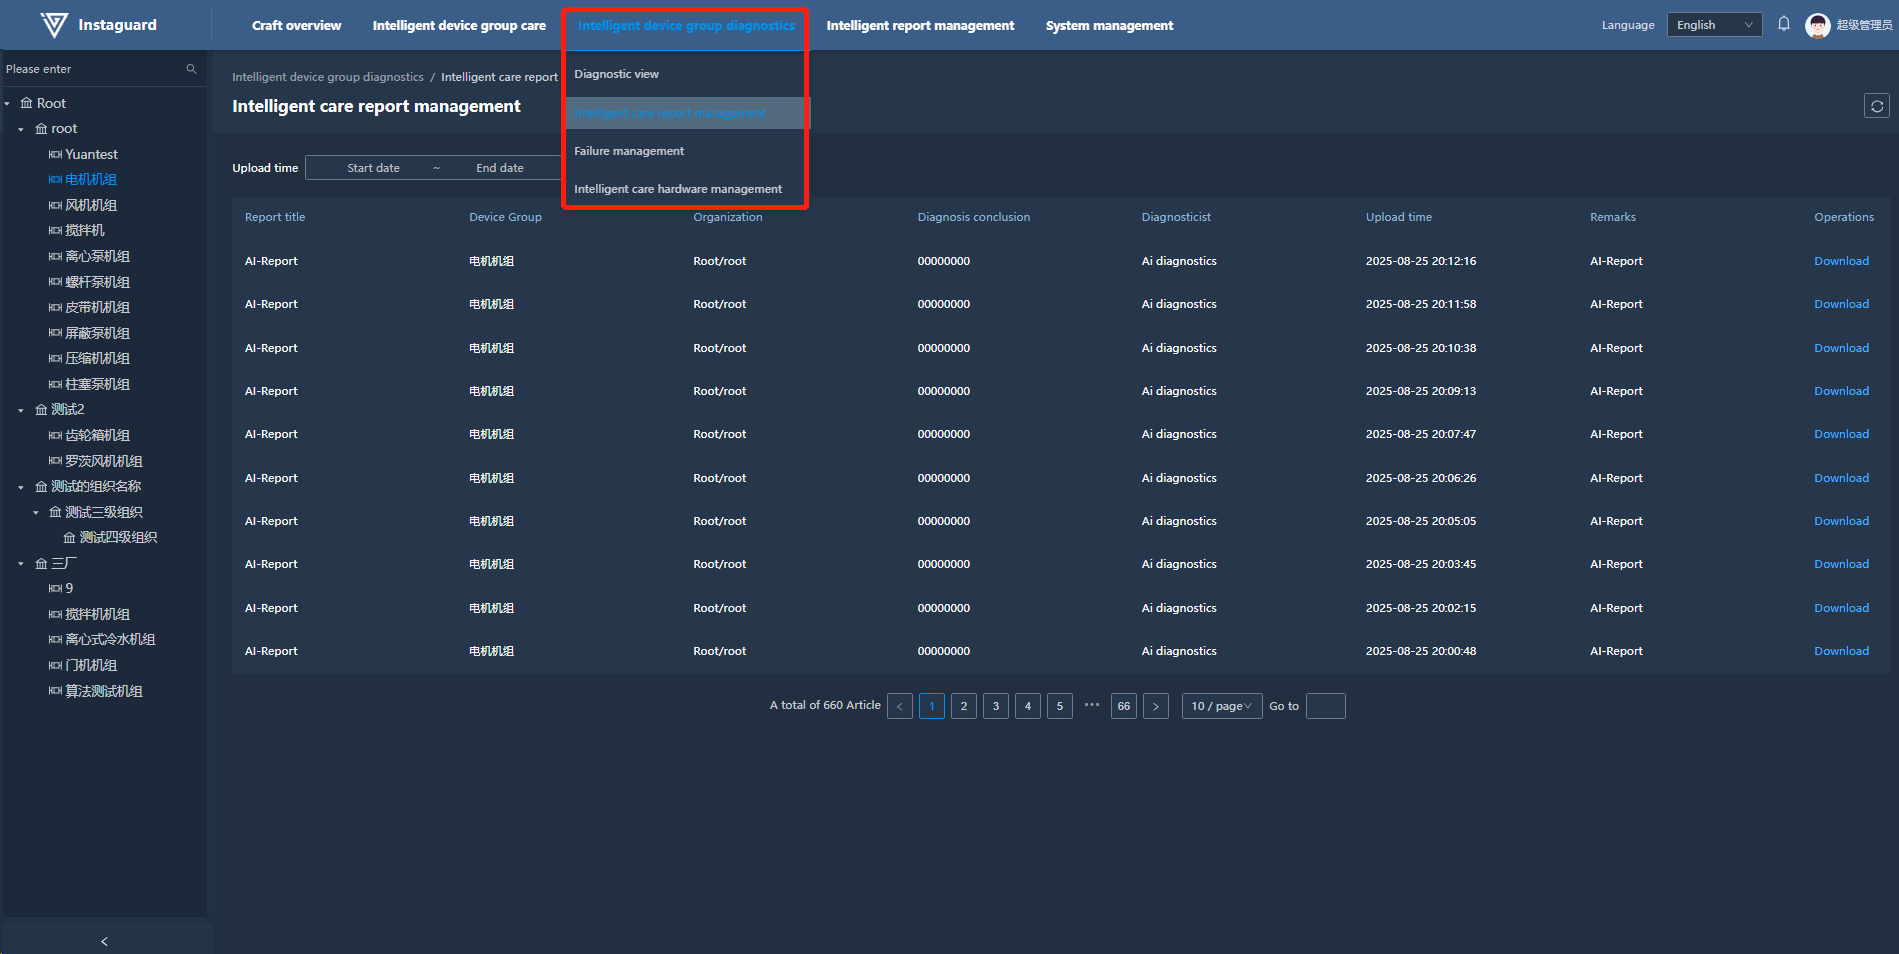
2.2 Function Overview
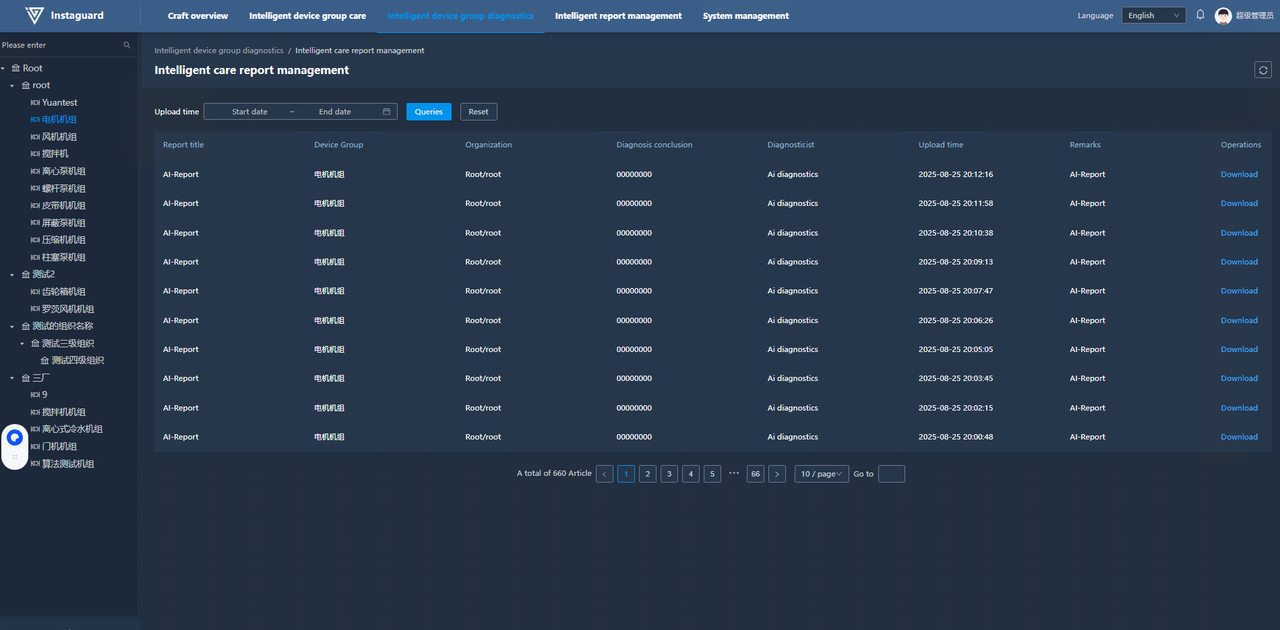
Manage and query intelligent care reports to help users efficiently obtain and analyze relevant data.
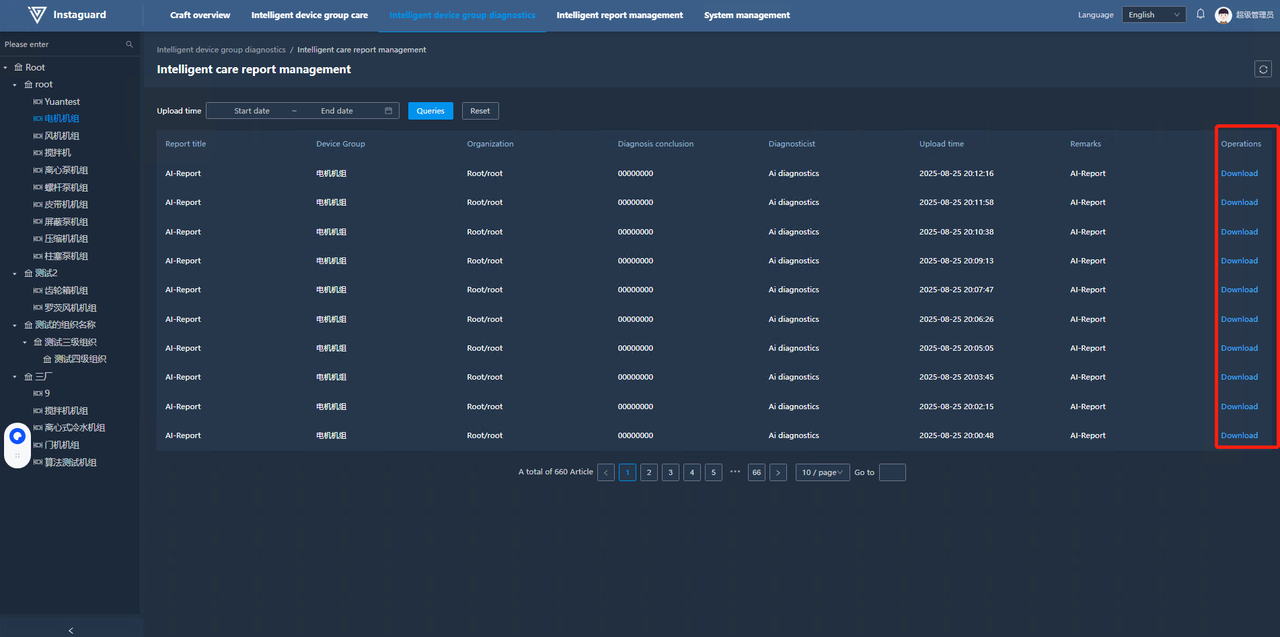
2.3 Download
Click the "Download" button behind a report to download the intelligent care report.
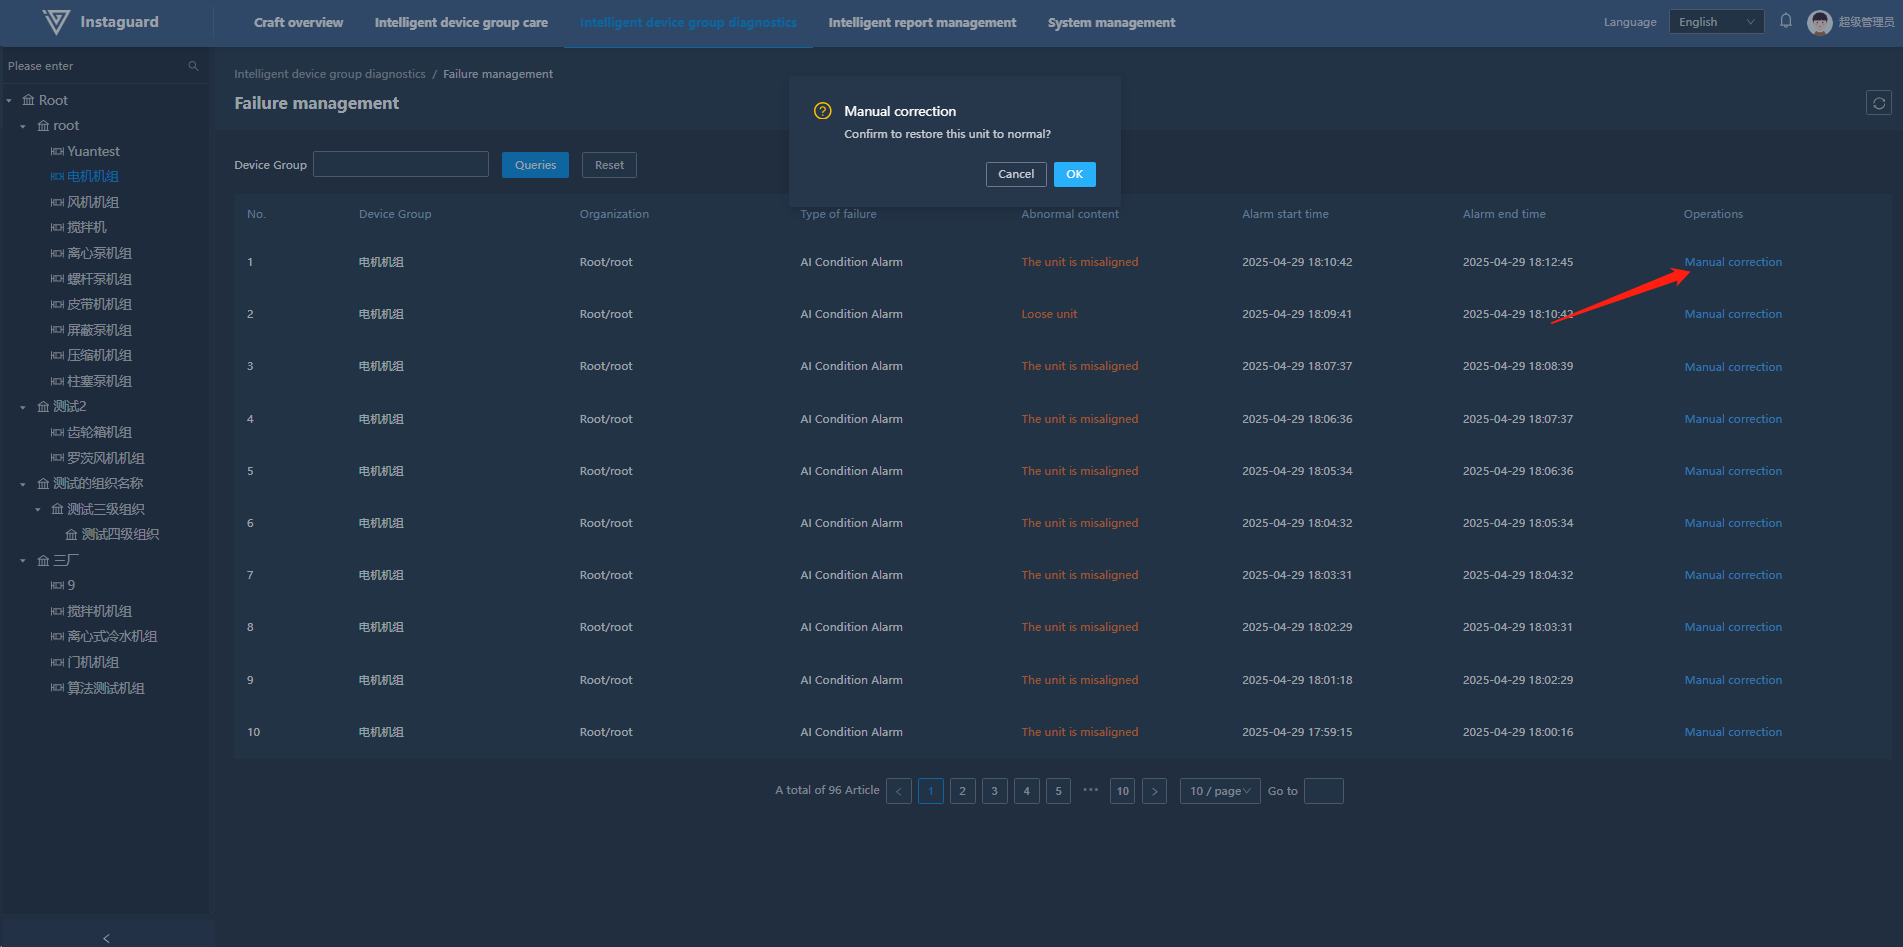
3. Abnormality Management
3.1 Navigation Path
「Intelligent Unit Diagnosis」 → 「Abnormality Management」
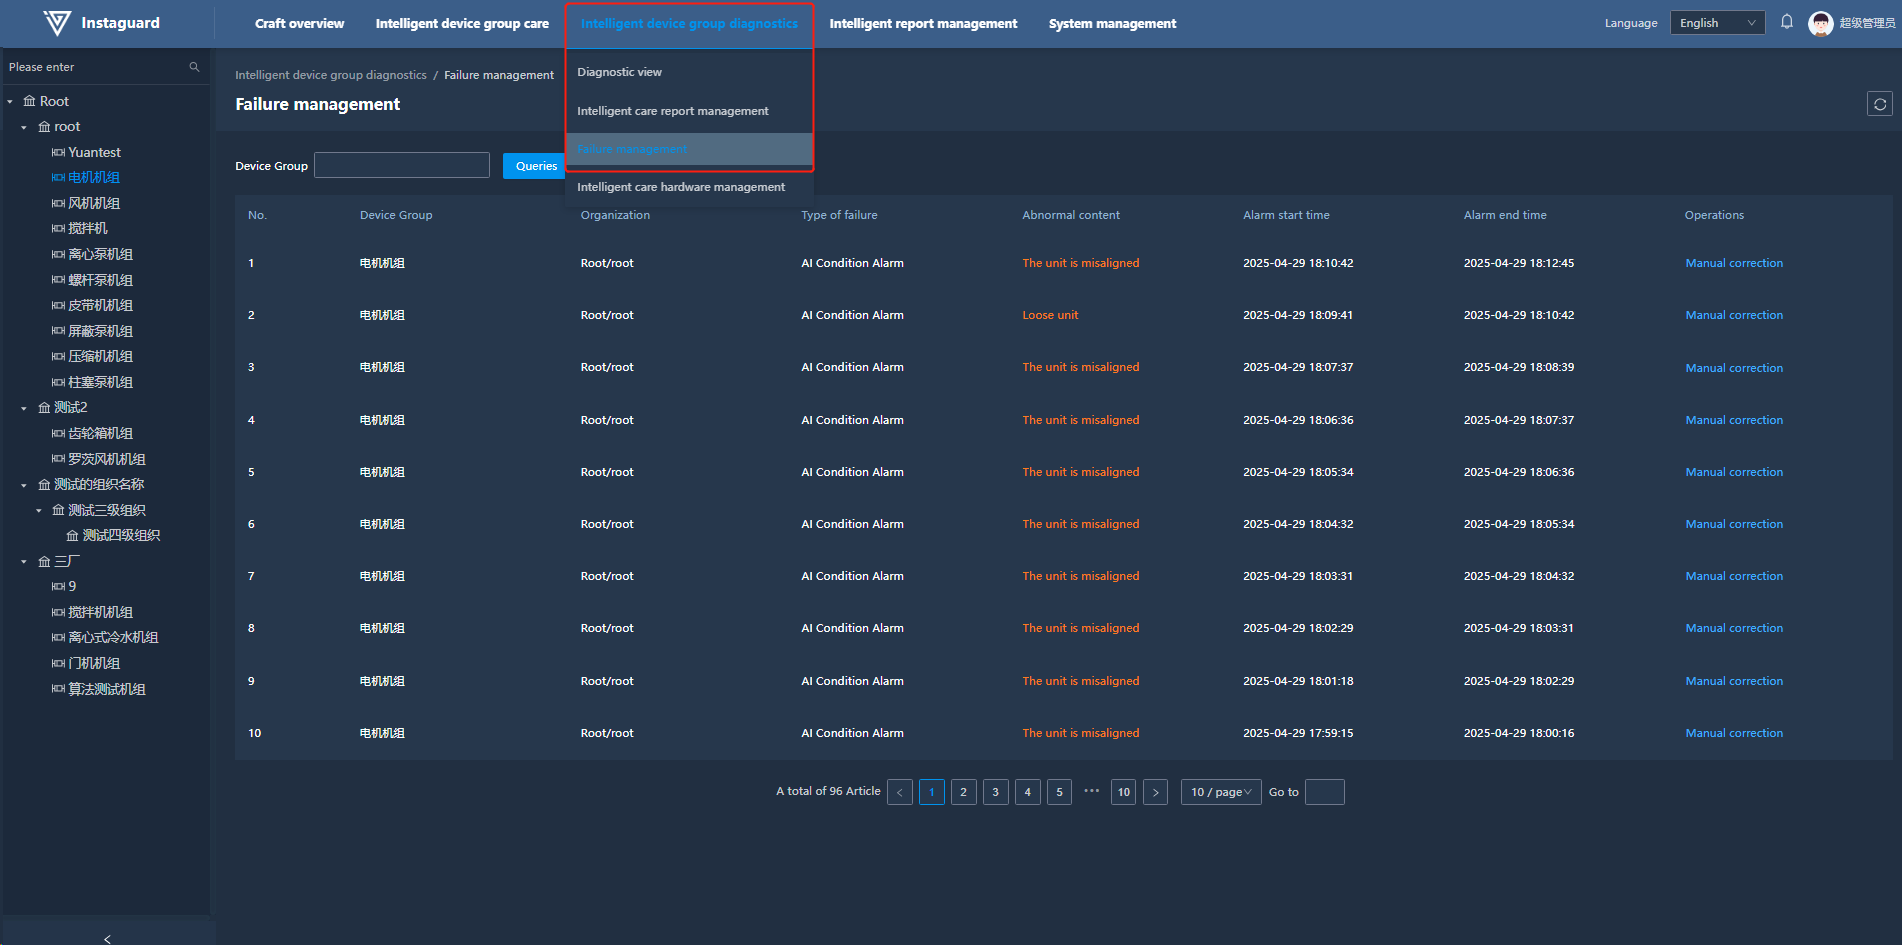
3.2 Function Overview
Monitor and manage production abnormalities in real-time, enabling timely actions to ensure production safety and efficiency.
3.3 Abnormality Content
Click "Abnormality Content" to jump to the corresponding diagnostic view.
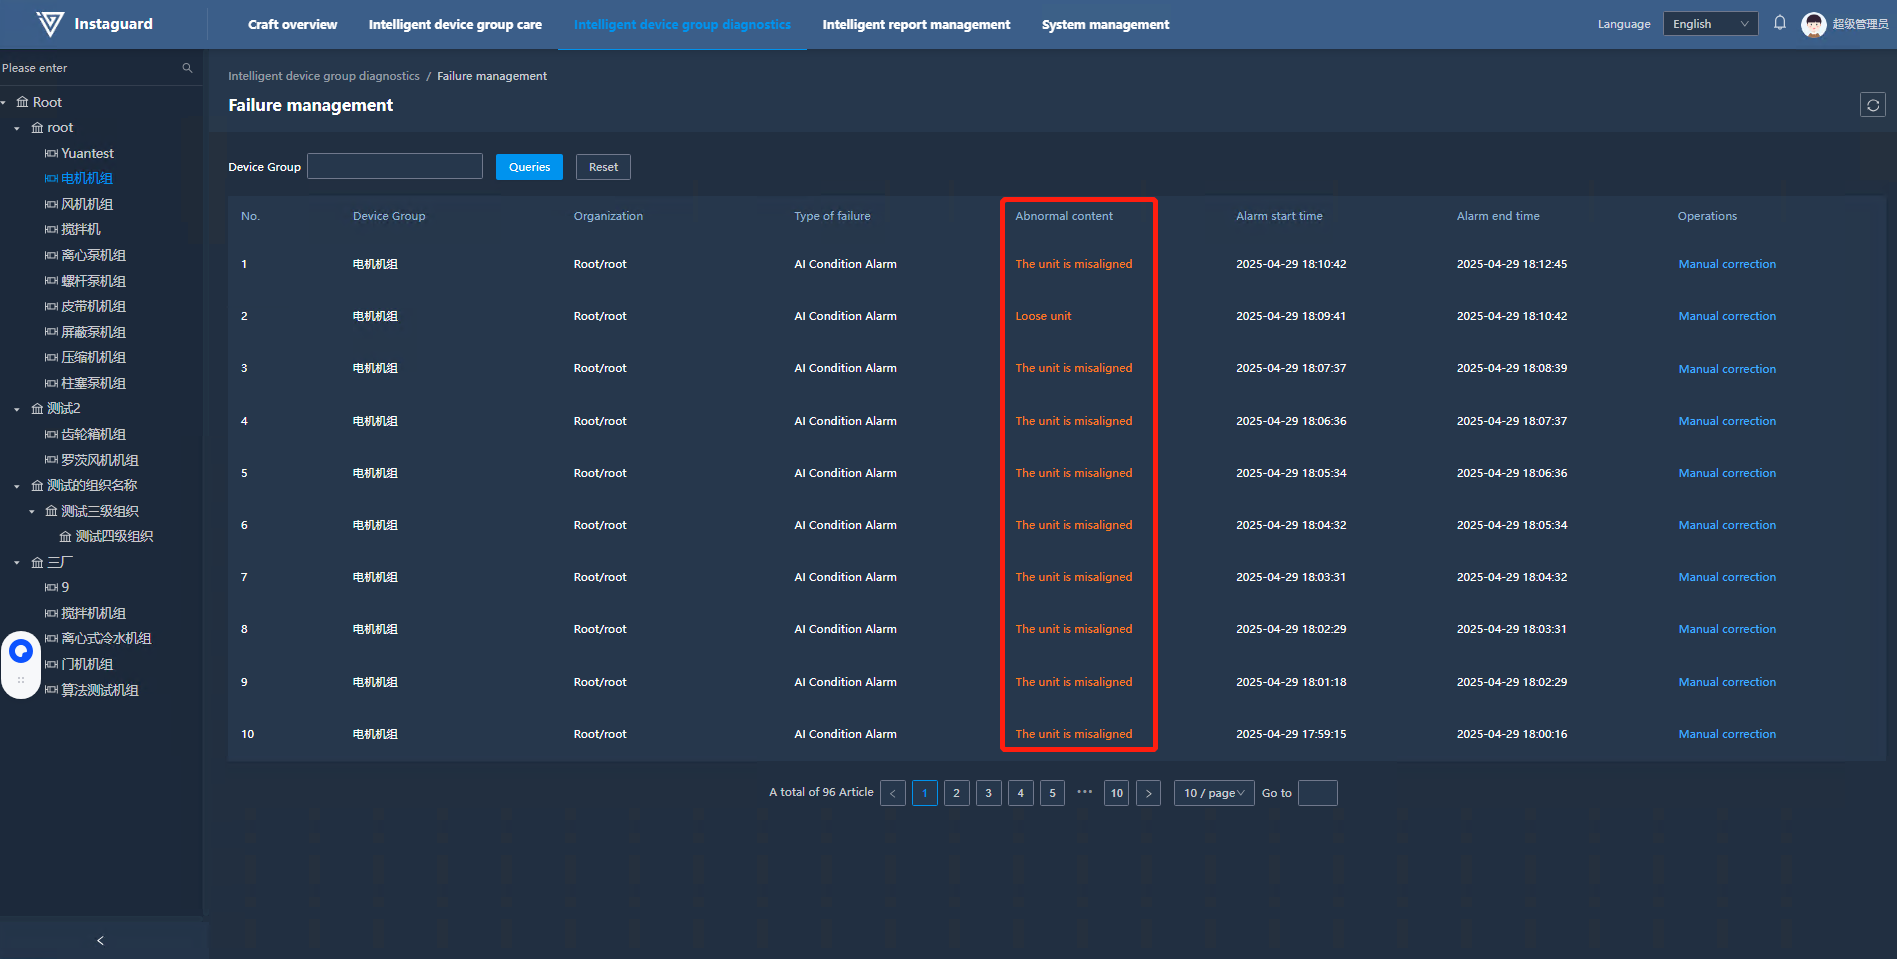
3.4 Manual Correction
Click the "Manual Correction" button behind an abnormality to mark it as normal.
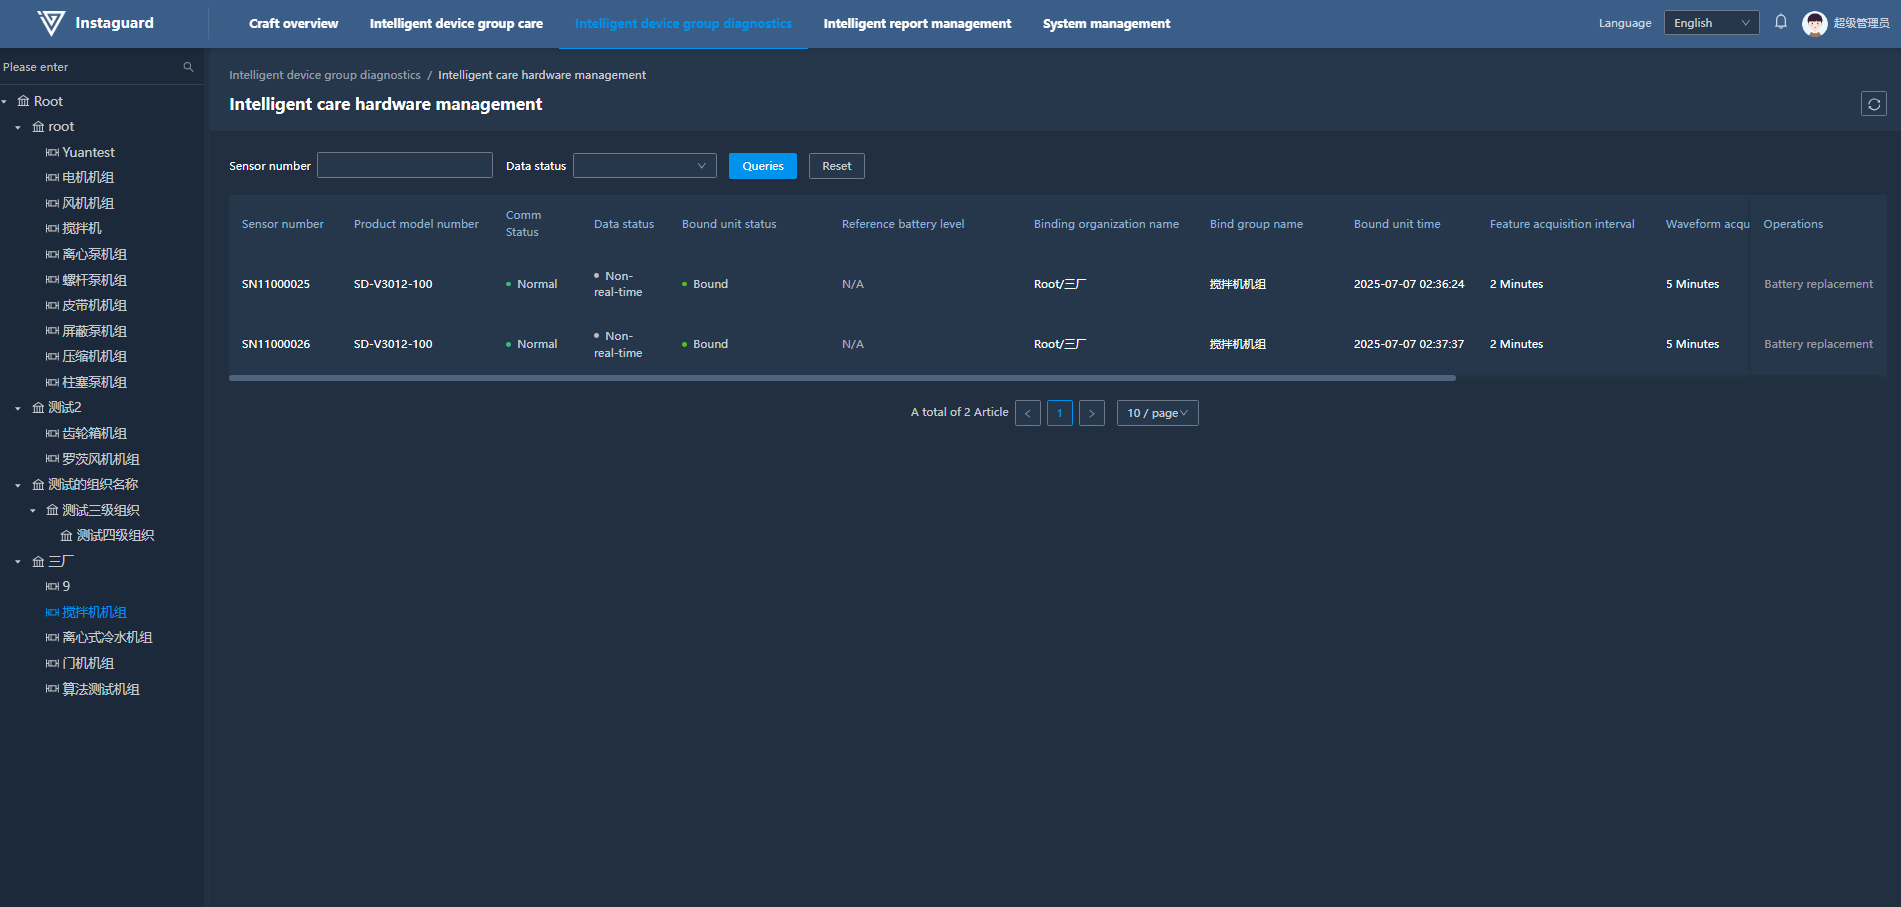
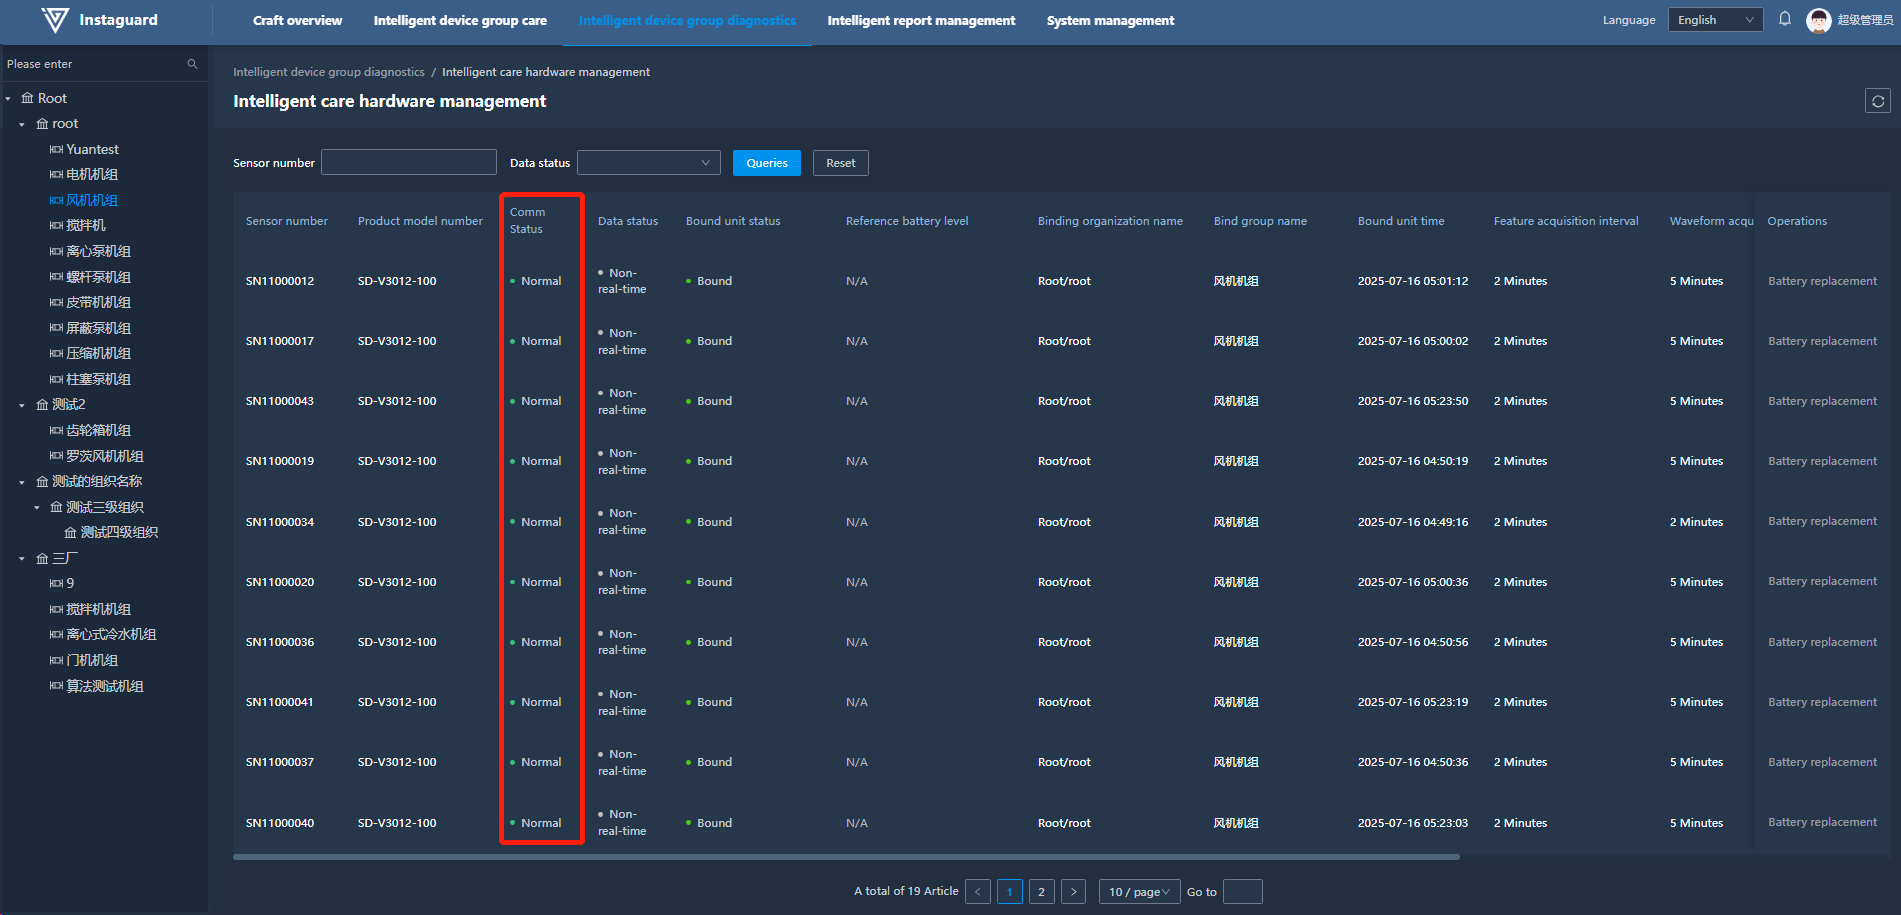
4. Intelligent Care Hardware Management
4.1 Navigation Path
「Intelligent Unit Diagnosis」 → 「Intelligent Care Hardware Management」
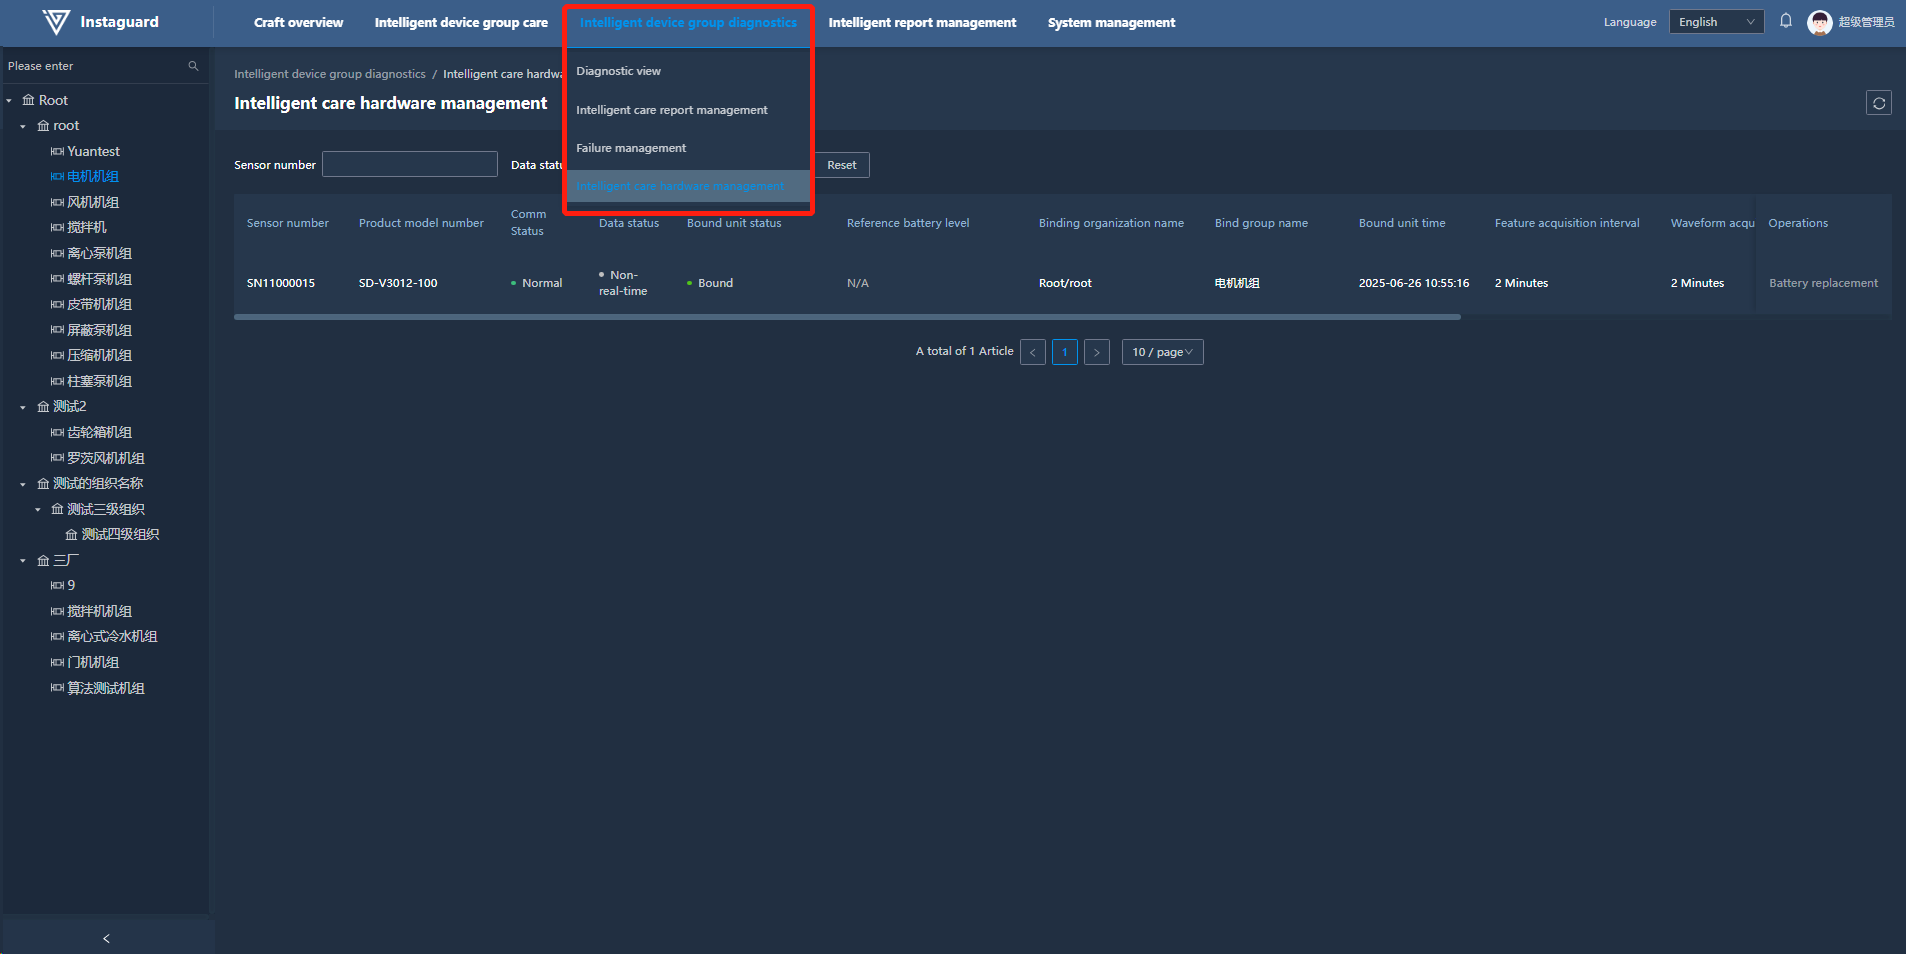
4.2 Function Overview
Monitor and manage the status of intelligent care hardware to ensure normal operation and maintenance.
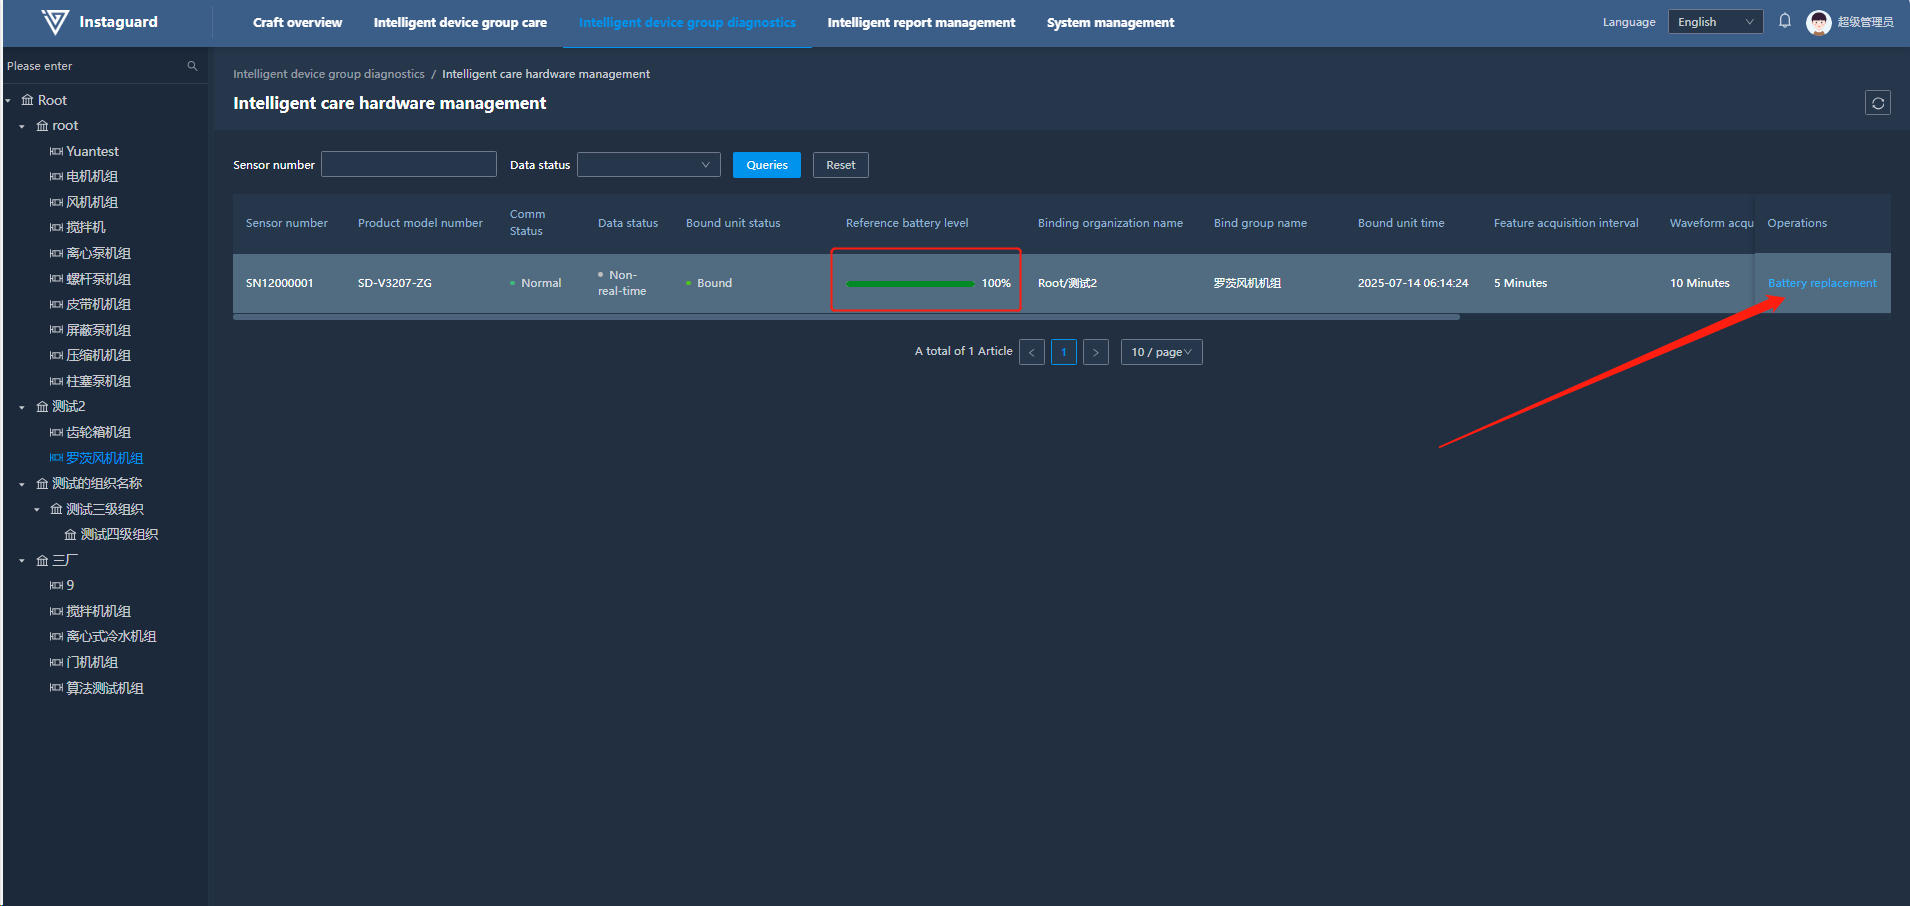
4.3 Battery Replacement
Click the "Battery Replacement" button after replacing the battery to reset the battery level, which will be displayed as:
4.4 Communication Status
The communication status is categorized into Normal, Delayed, and Offline.
Normal: The status is considered normal when sensor waveform data is uploaded at the set data upload frequency.
Delayed: The status is marked as delayed when no sensor waveform data has been uploaded for a period greater than or equal to two times the set data upload frequency.
Offline: The status is considered offline when no sensor waveform data has been uploaded for a period greater than or equal to ten times the set data upload frequency.
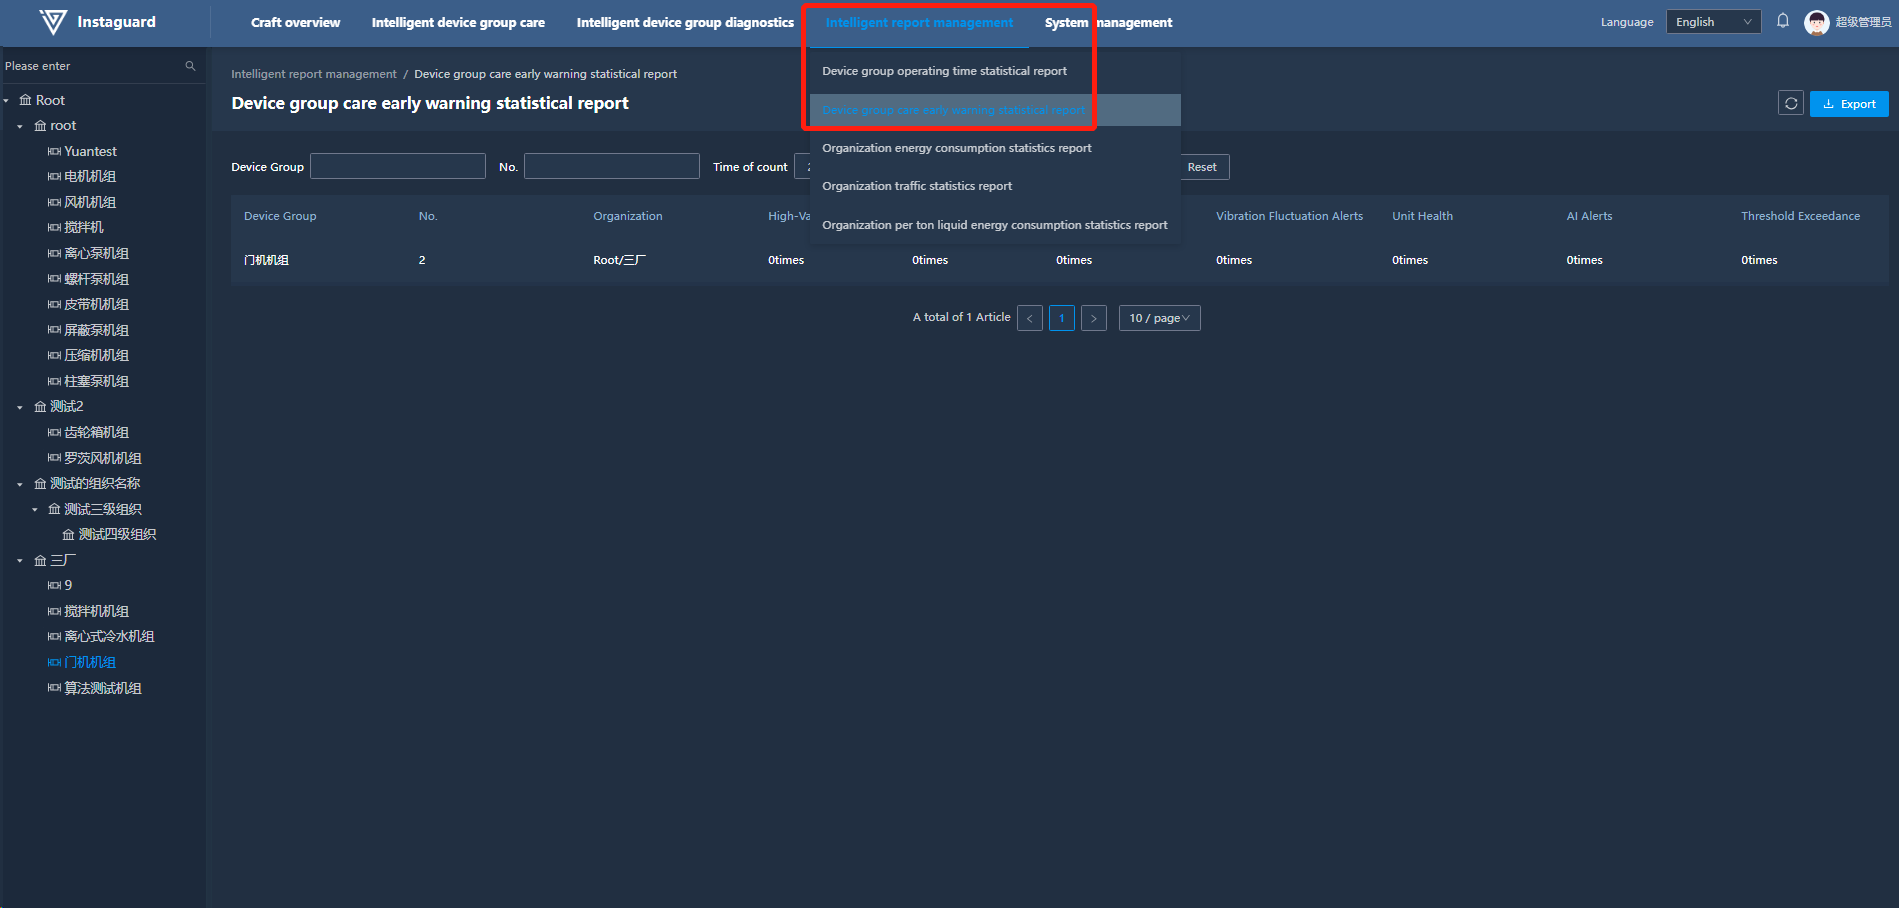
Intelligent Report Management
1. Unit Operation Time Statistical Report
1.1 Navigation Path
「Intelligent Report Management」 → 「Unit Operation Time Statistical Report」
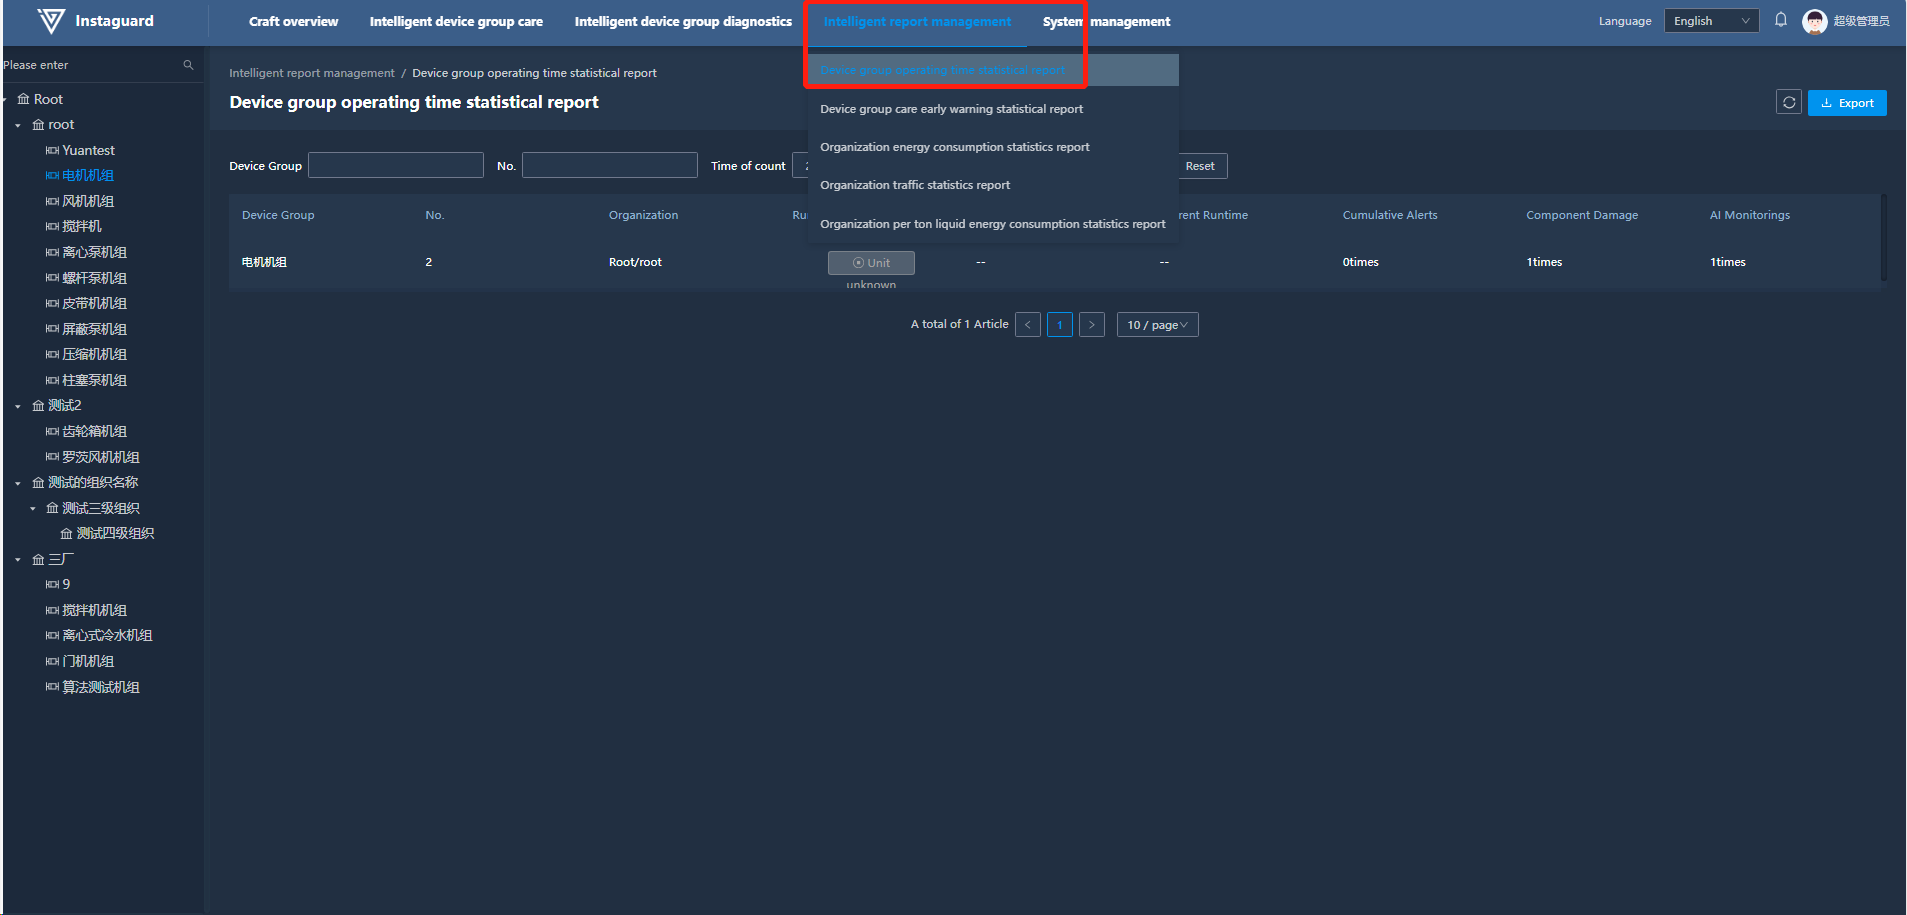
1.2 Function Overview
Monitors and collects the operating hours and other relevant data of the equipment unit, helping users understand the operational status of the unit for effective management and maintenance.
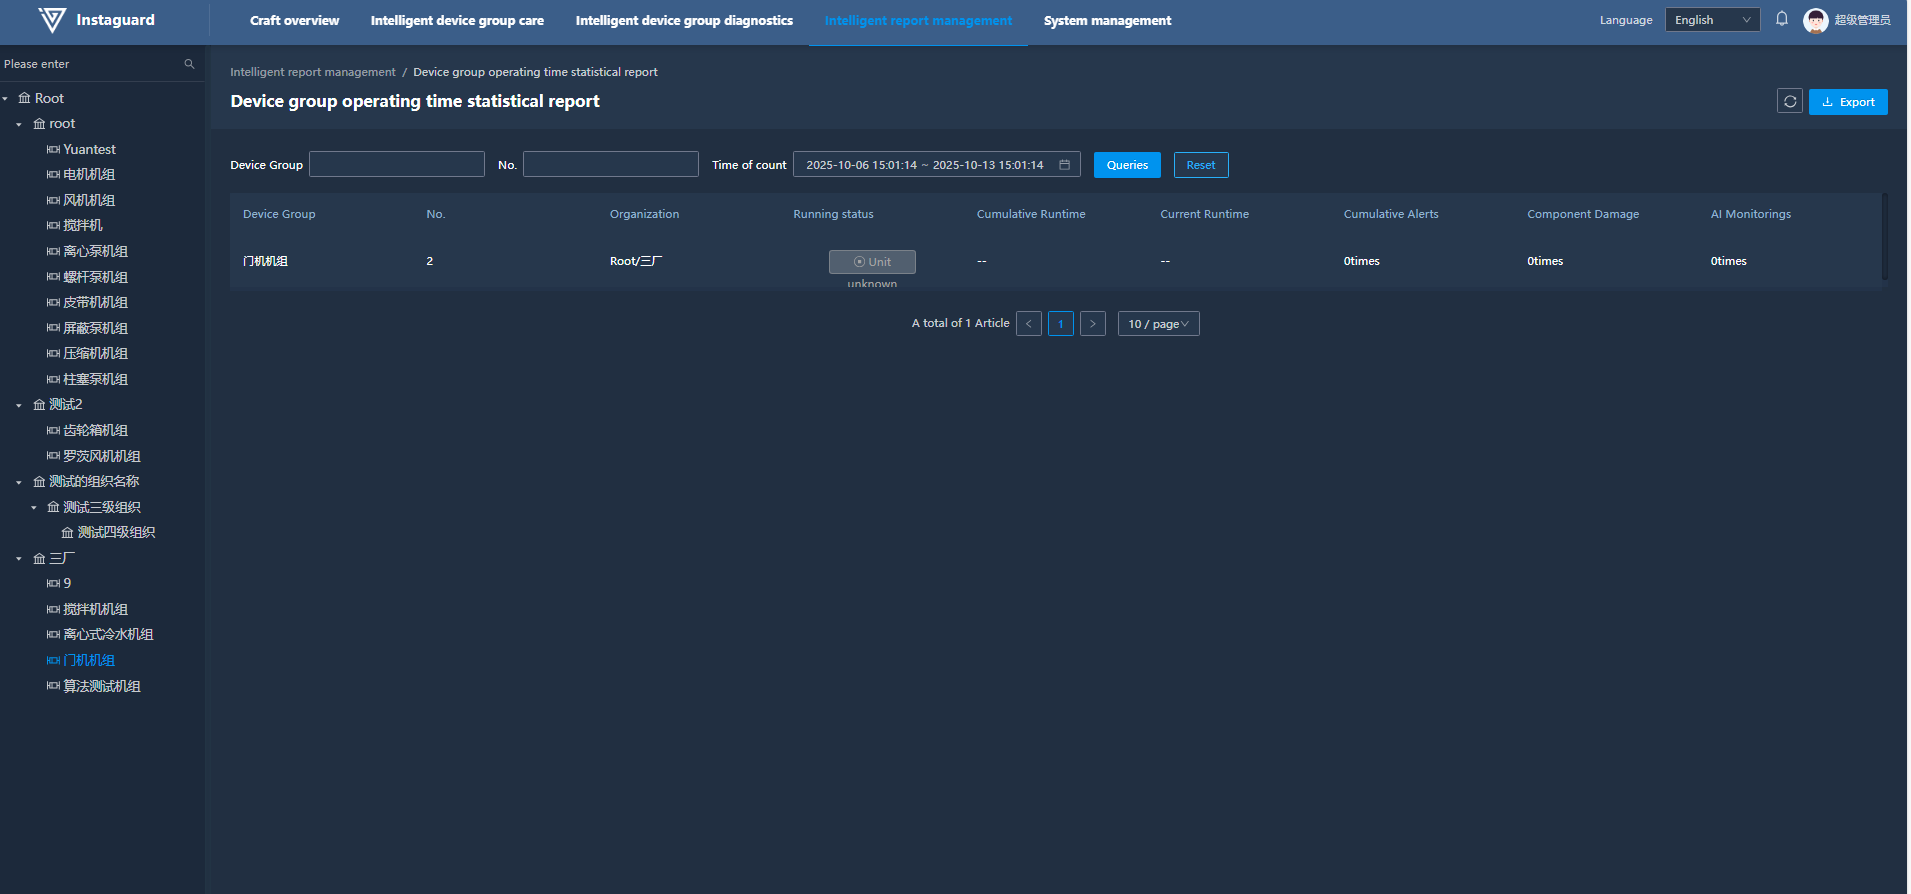
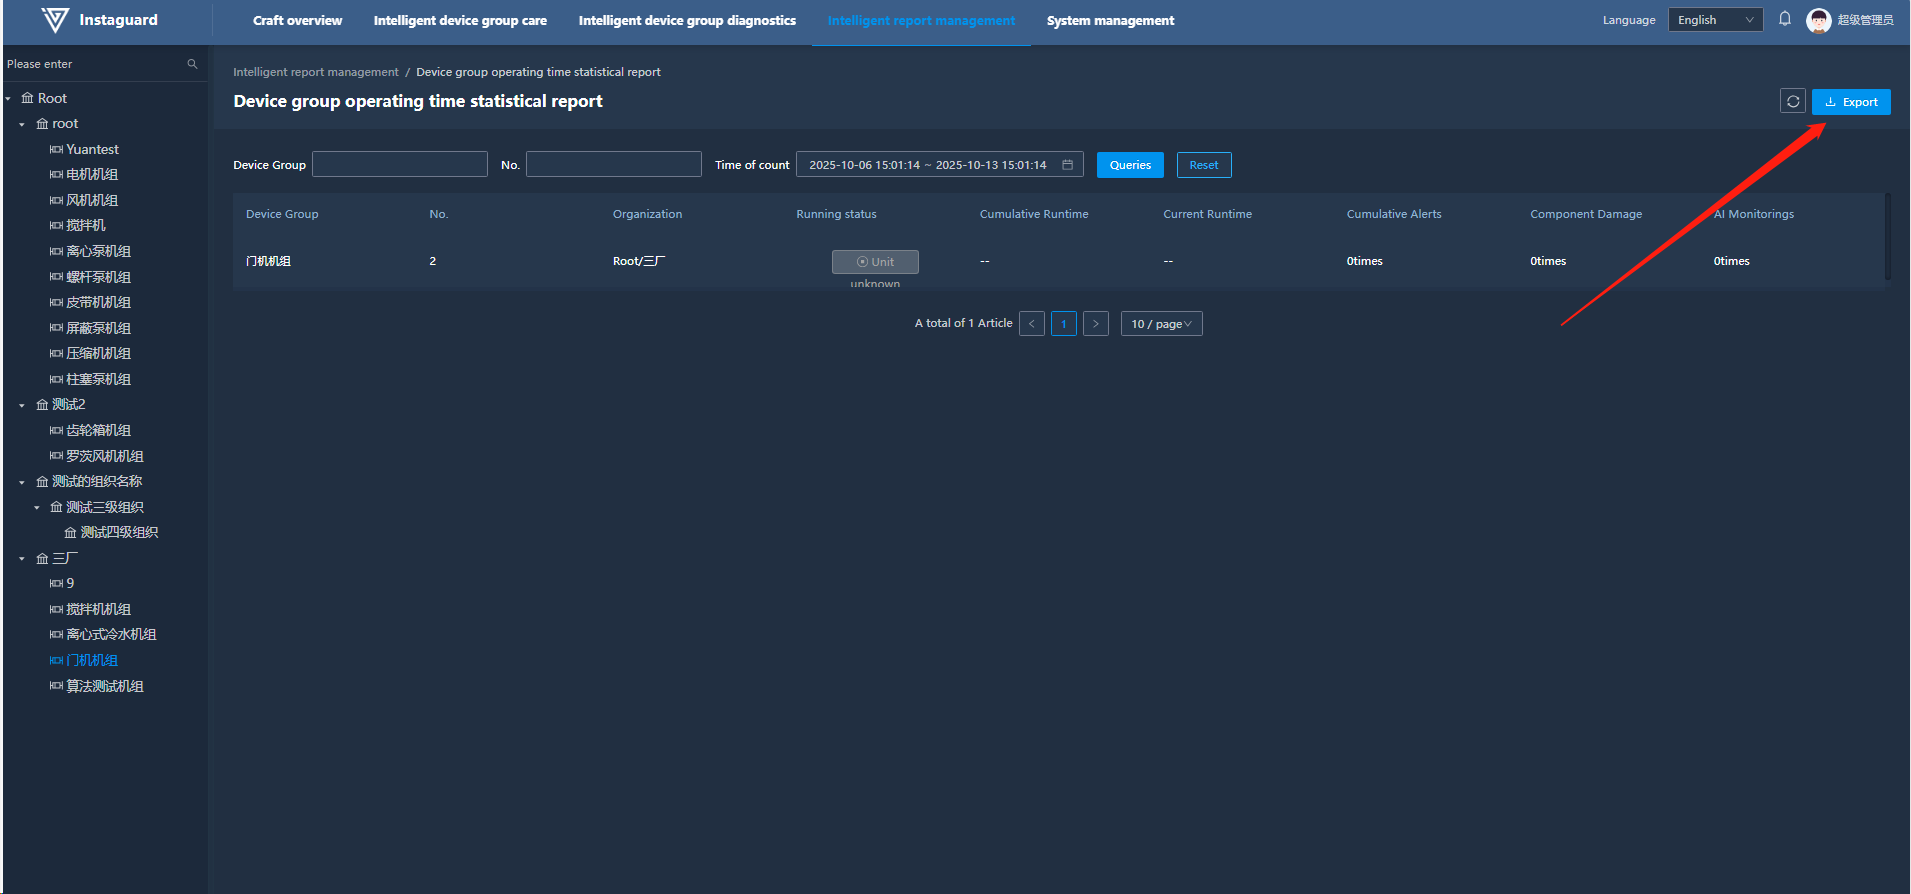
1.3 Data Export
Click the "Export" button at the upper-right of the report to export displayed data as an XLS file named "Unit Operation Time Statistical Report".
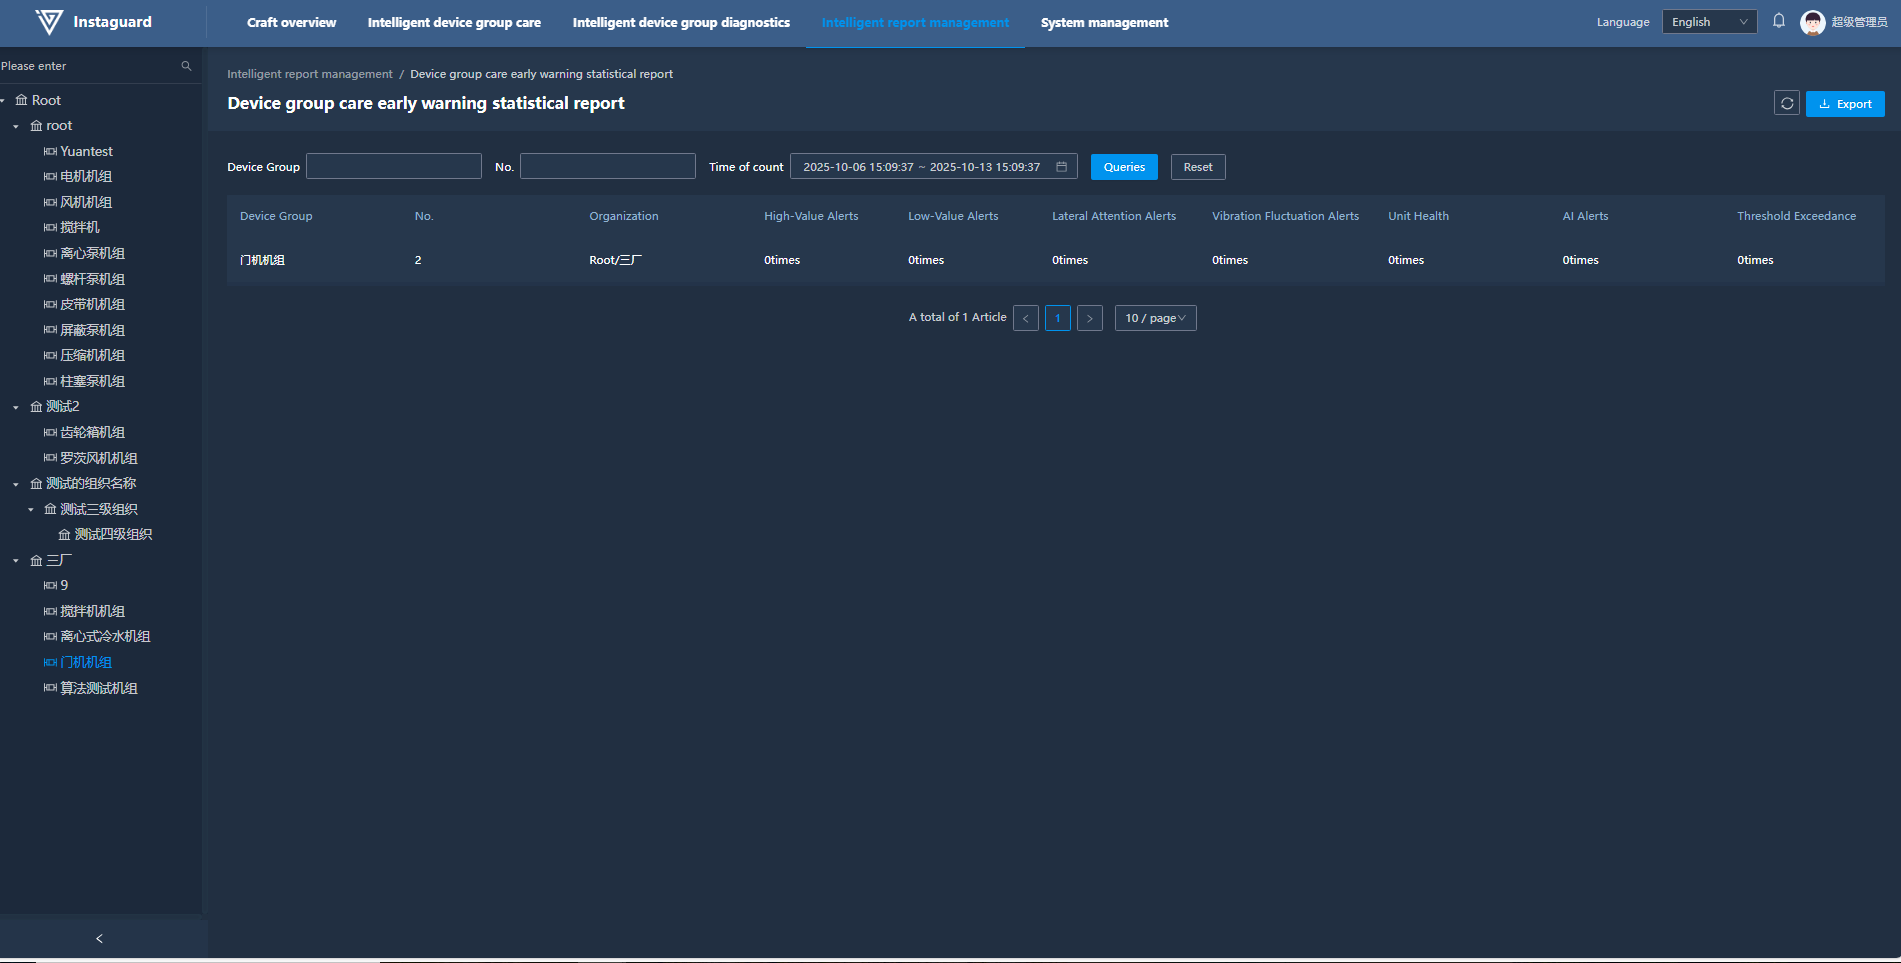
2. Equipment Unit Monitoring Alert Statistical Report
2.1 Navigation Path
Intelligent Report Management→ Equipment Unit Monitoring Alert Statistical Report
2.2 Function Overview
Monitors and manages the operational status of equipment units. By counting the occurrences of various alerts, it helps users promptly identify and address potential issues, ensuring the normal operation and maintenance of the units.
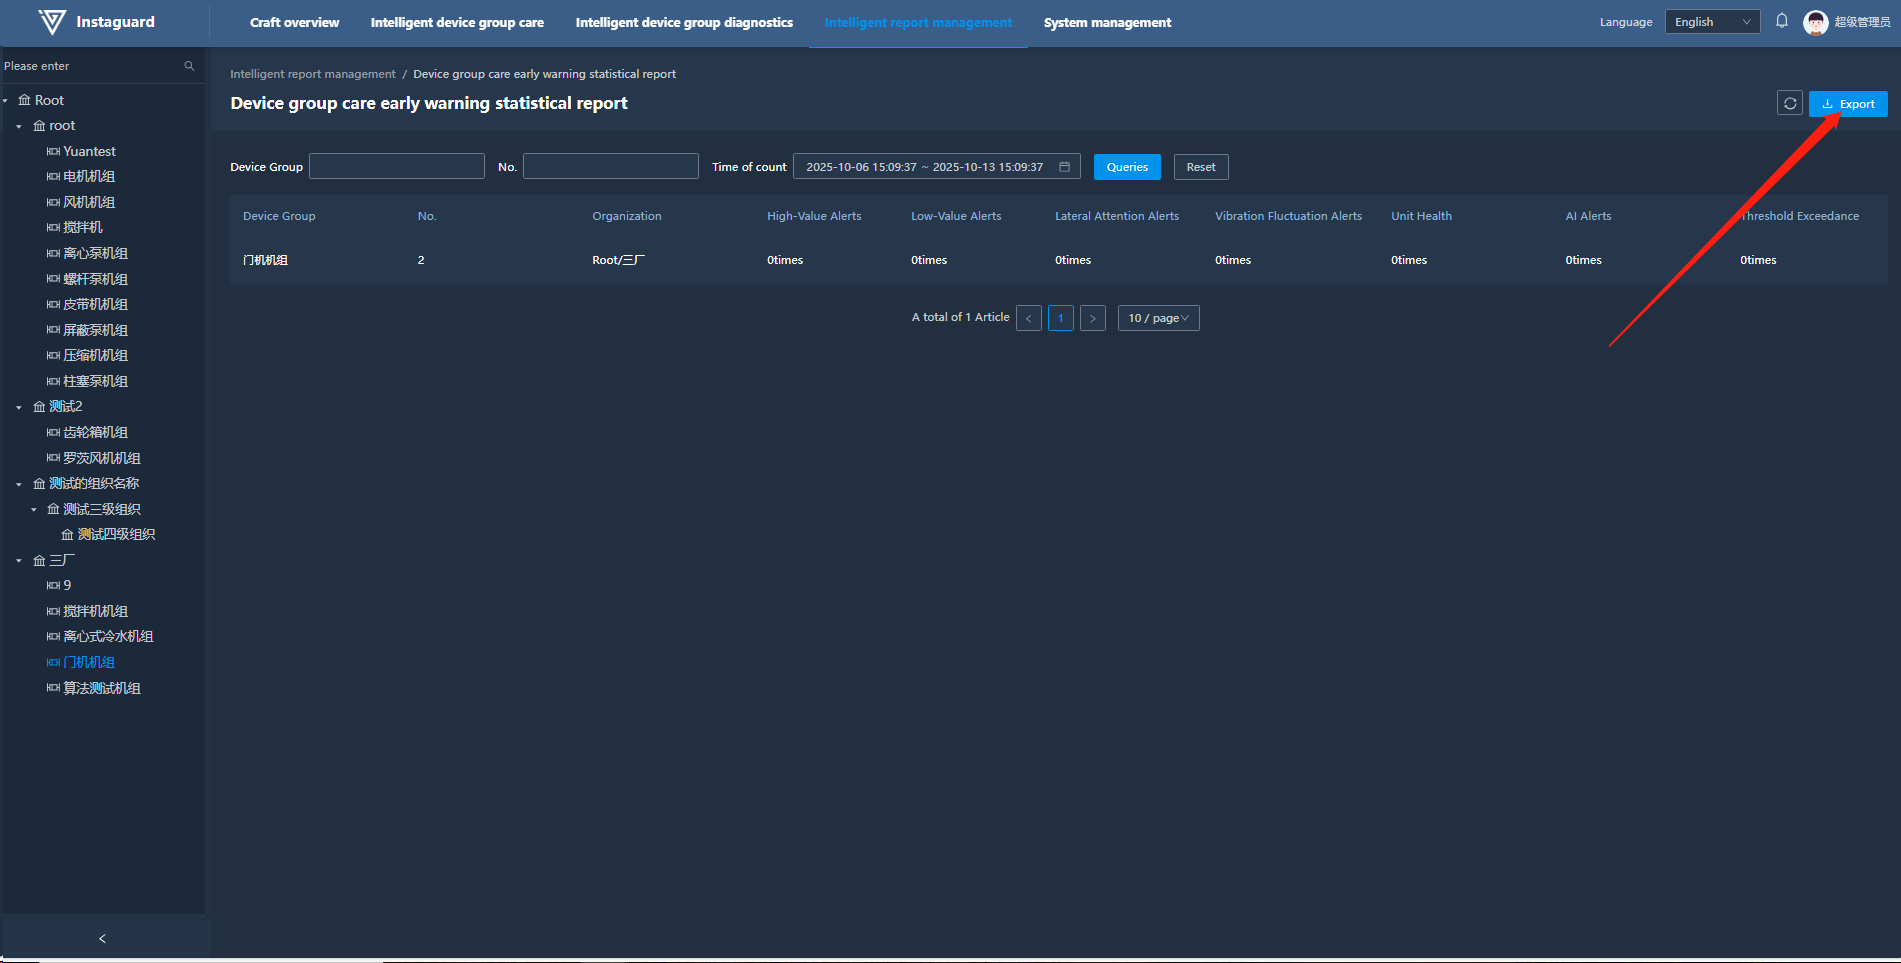
2.3 Data Export
After entering the report, click the export button in the upper right corner to export the currently displayed data. The export format is XLS, and the file name is: Equipment Unit Monitoring Alert Statistical Report.
System Management
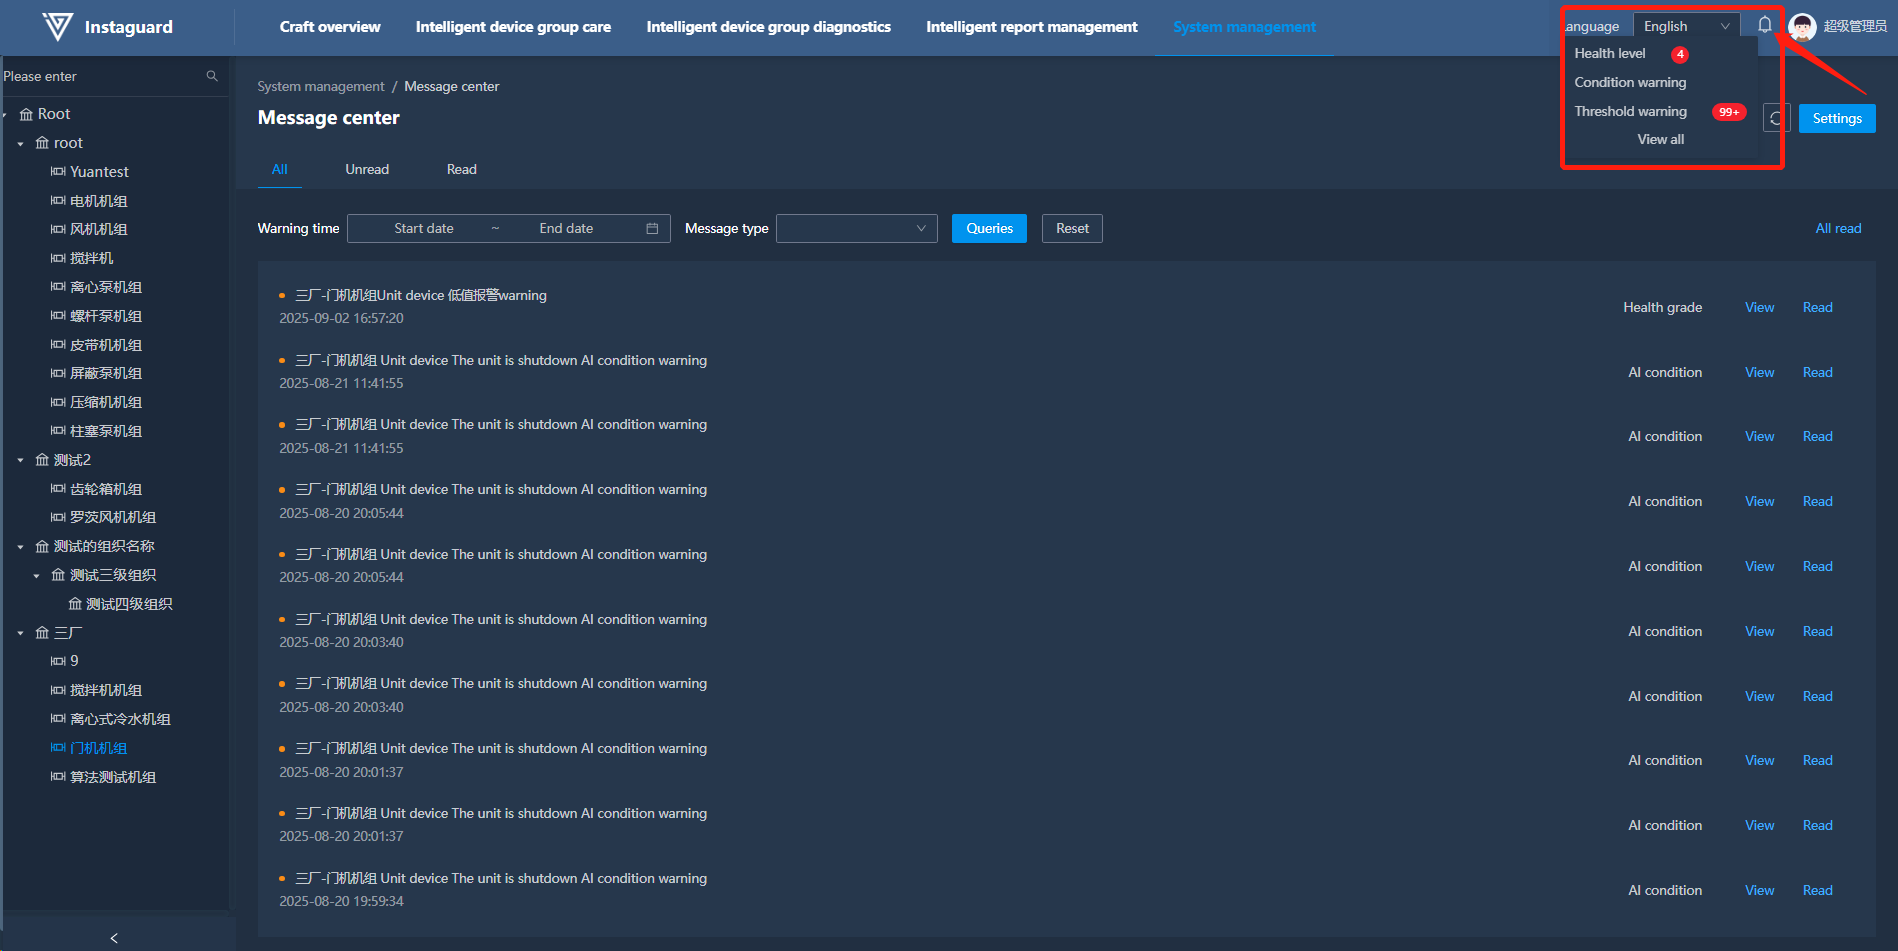
1. Message Center
1.1 Navigation Path
「System Management」 → 「Message Center」
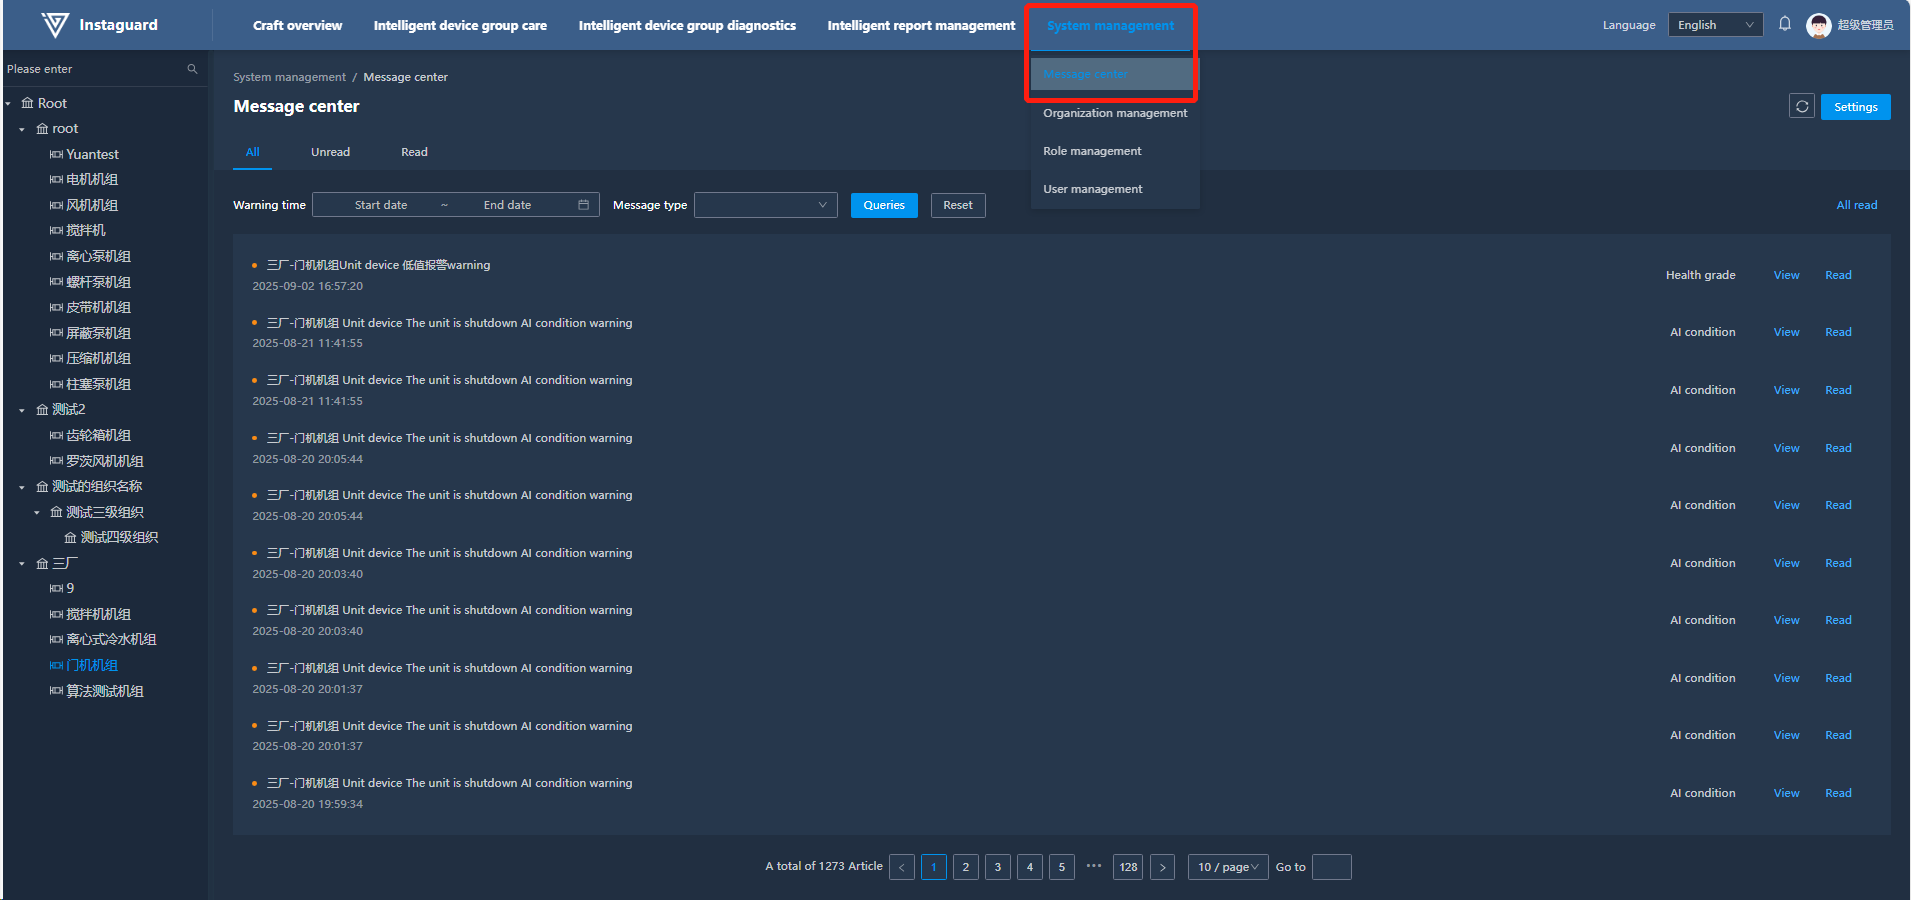
1.2 Function Overview
View system notifications in detail and set notification frequency, method, and unit scope as needed.
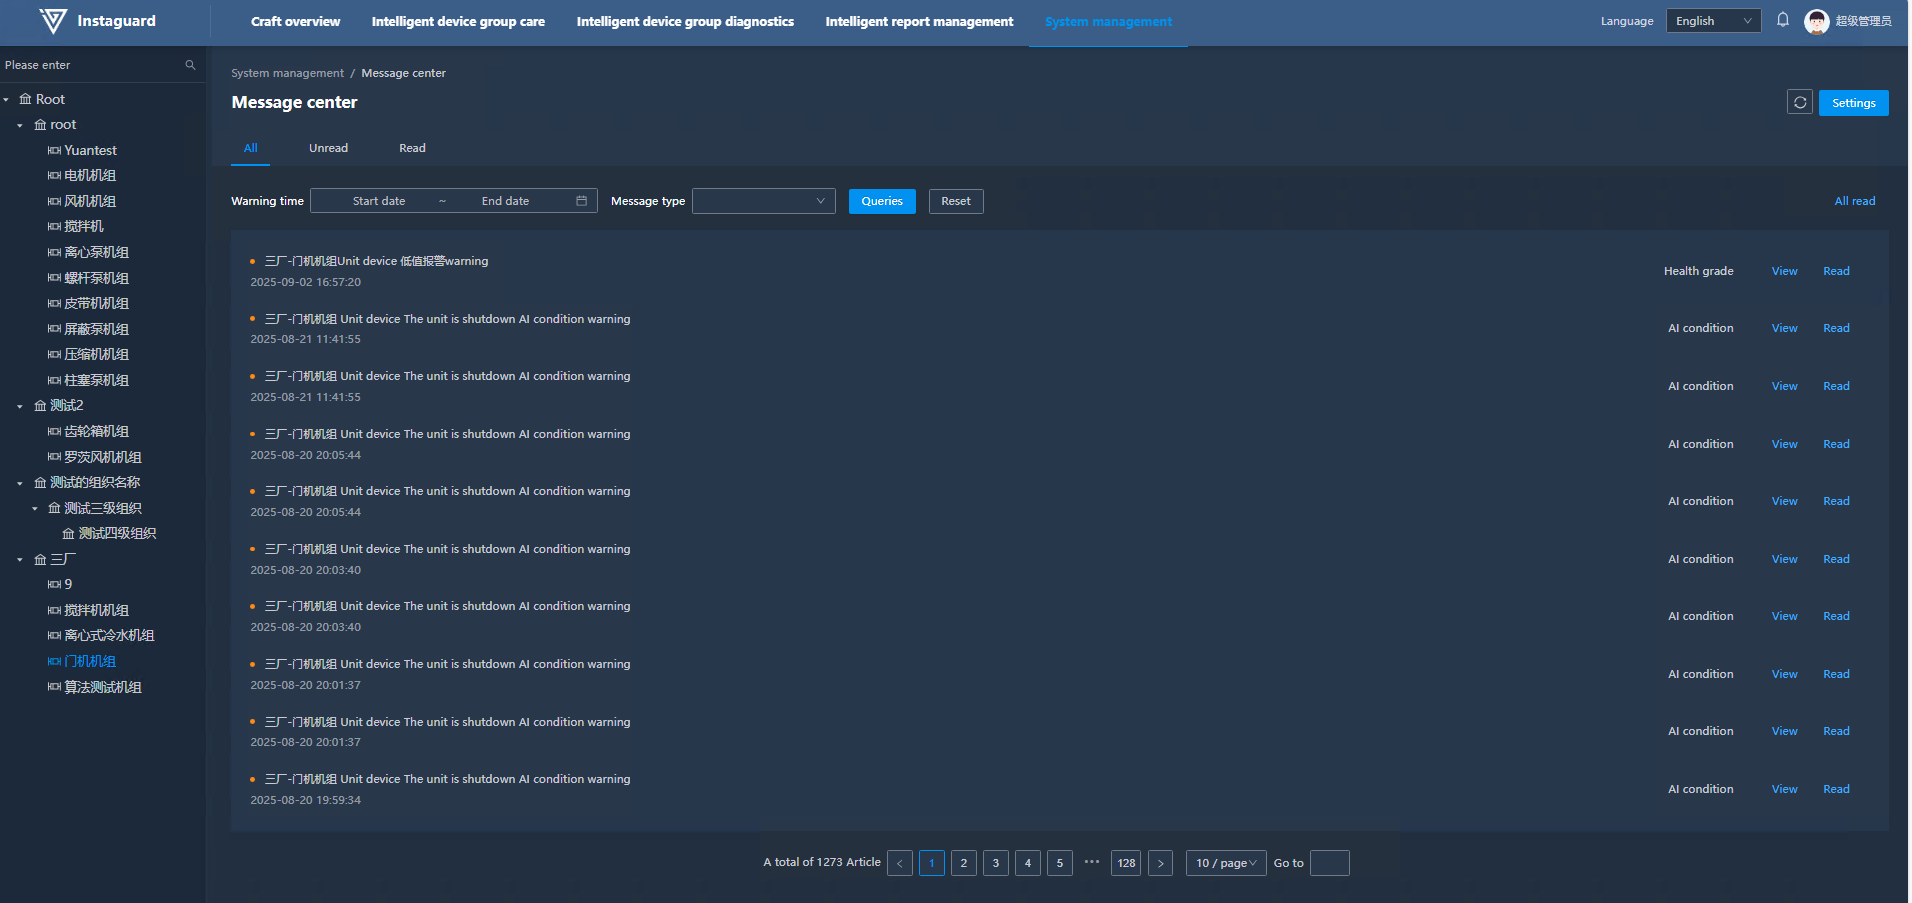
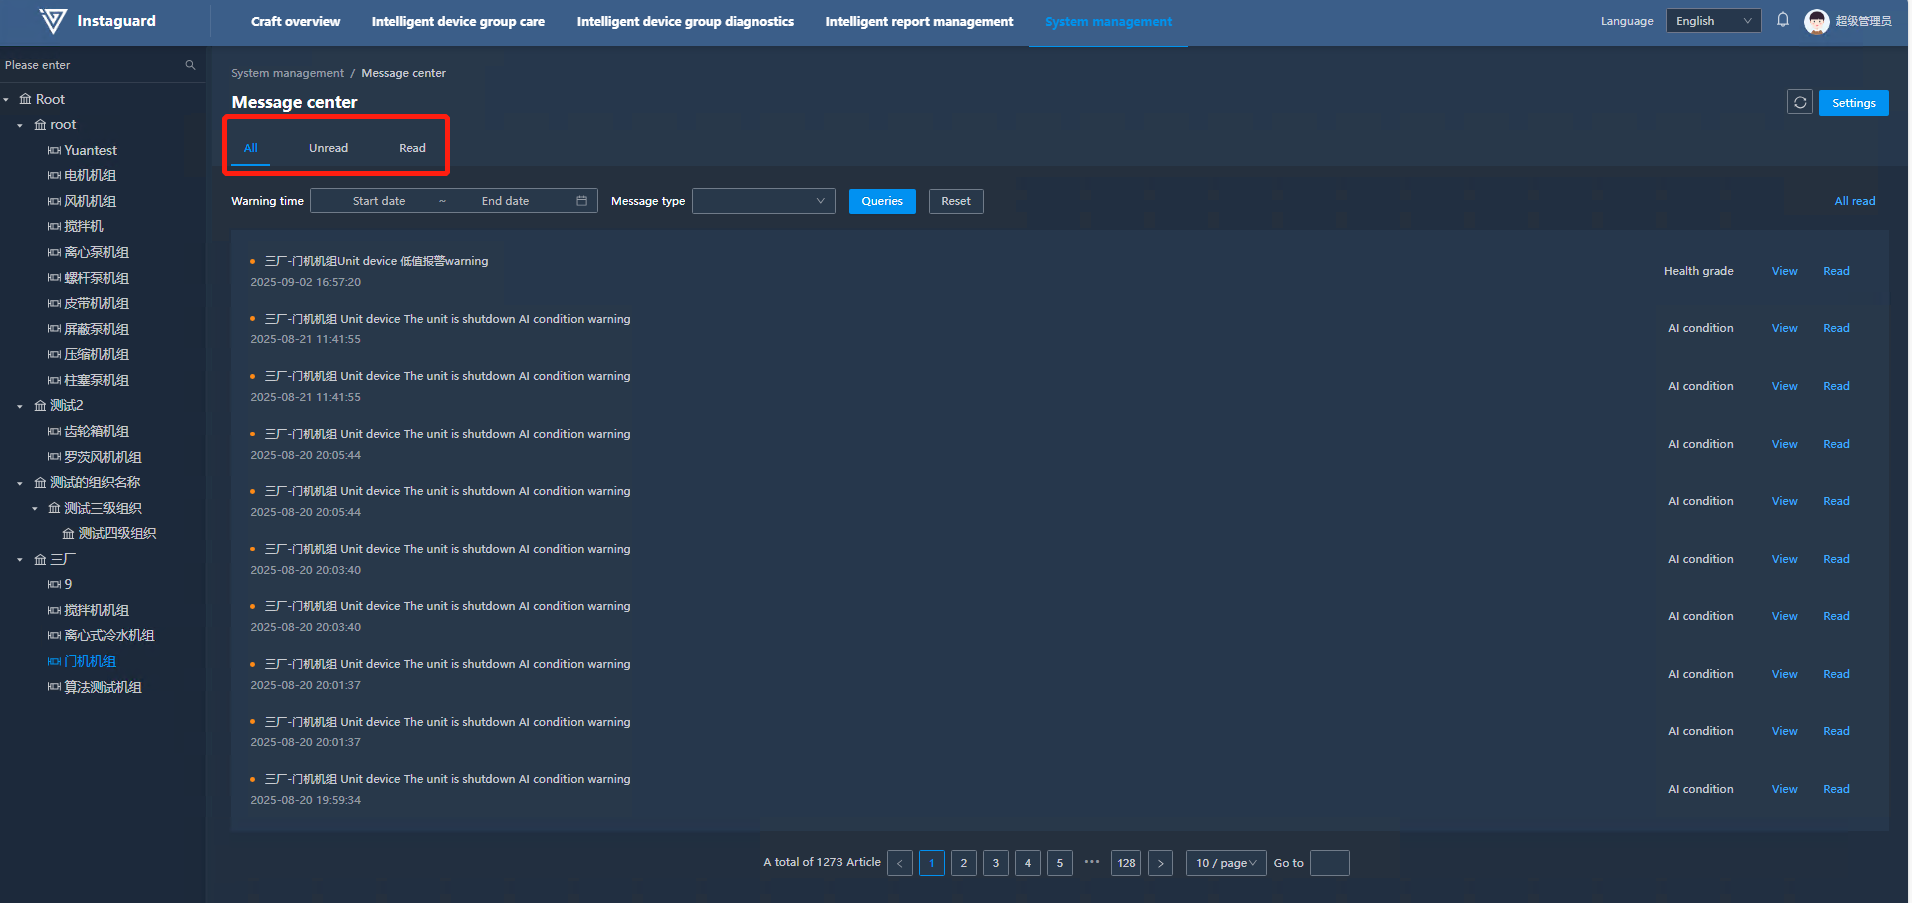
1.3 Message List
View system messages receivable by the current user, filtered by read status.
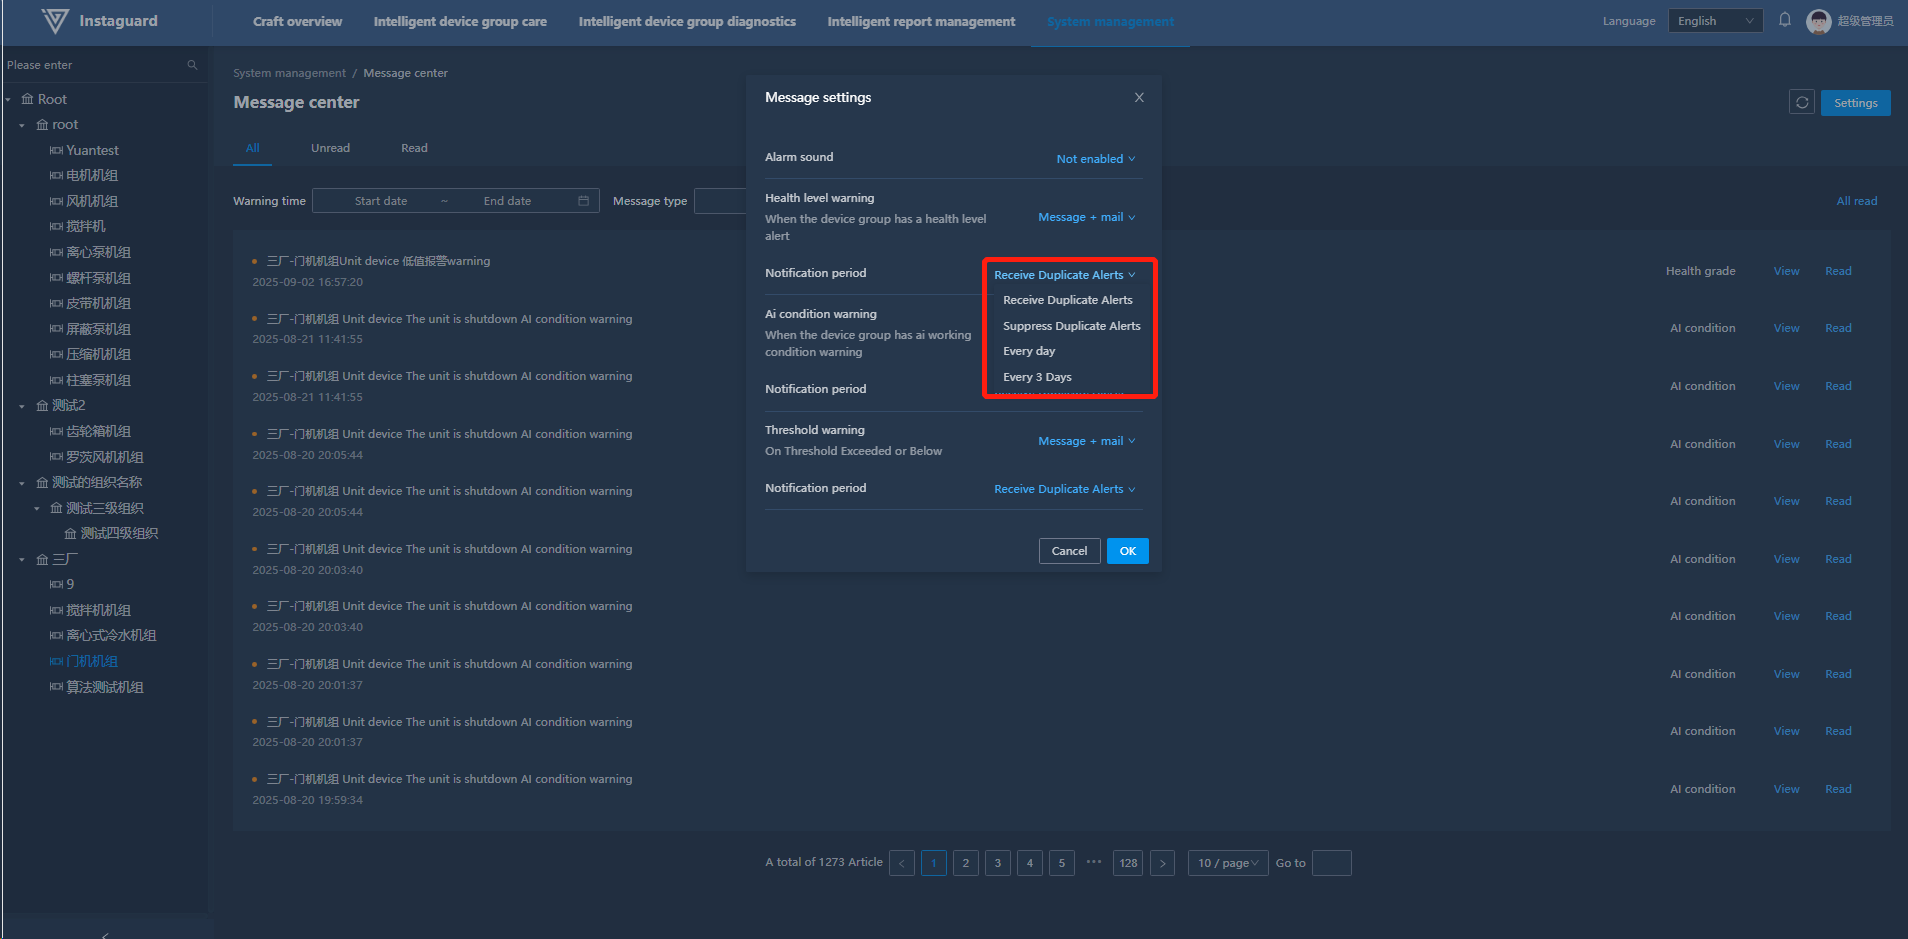
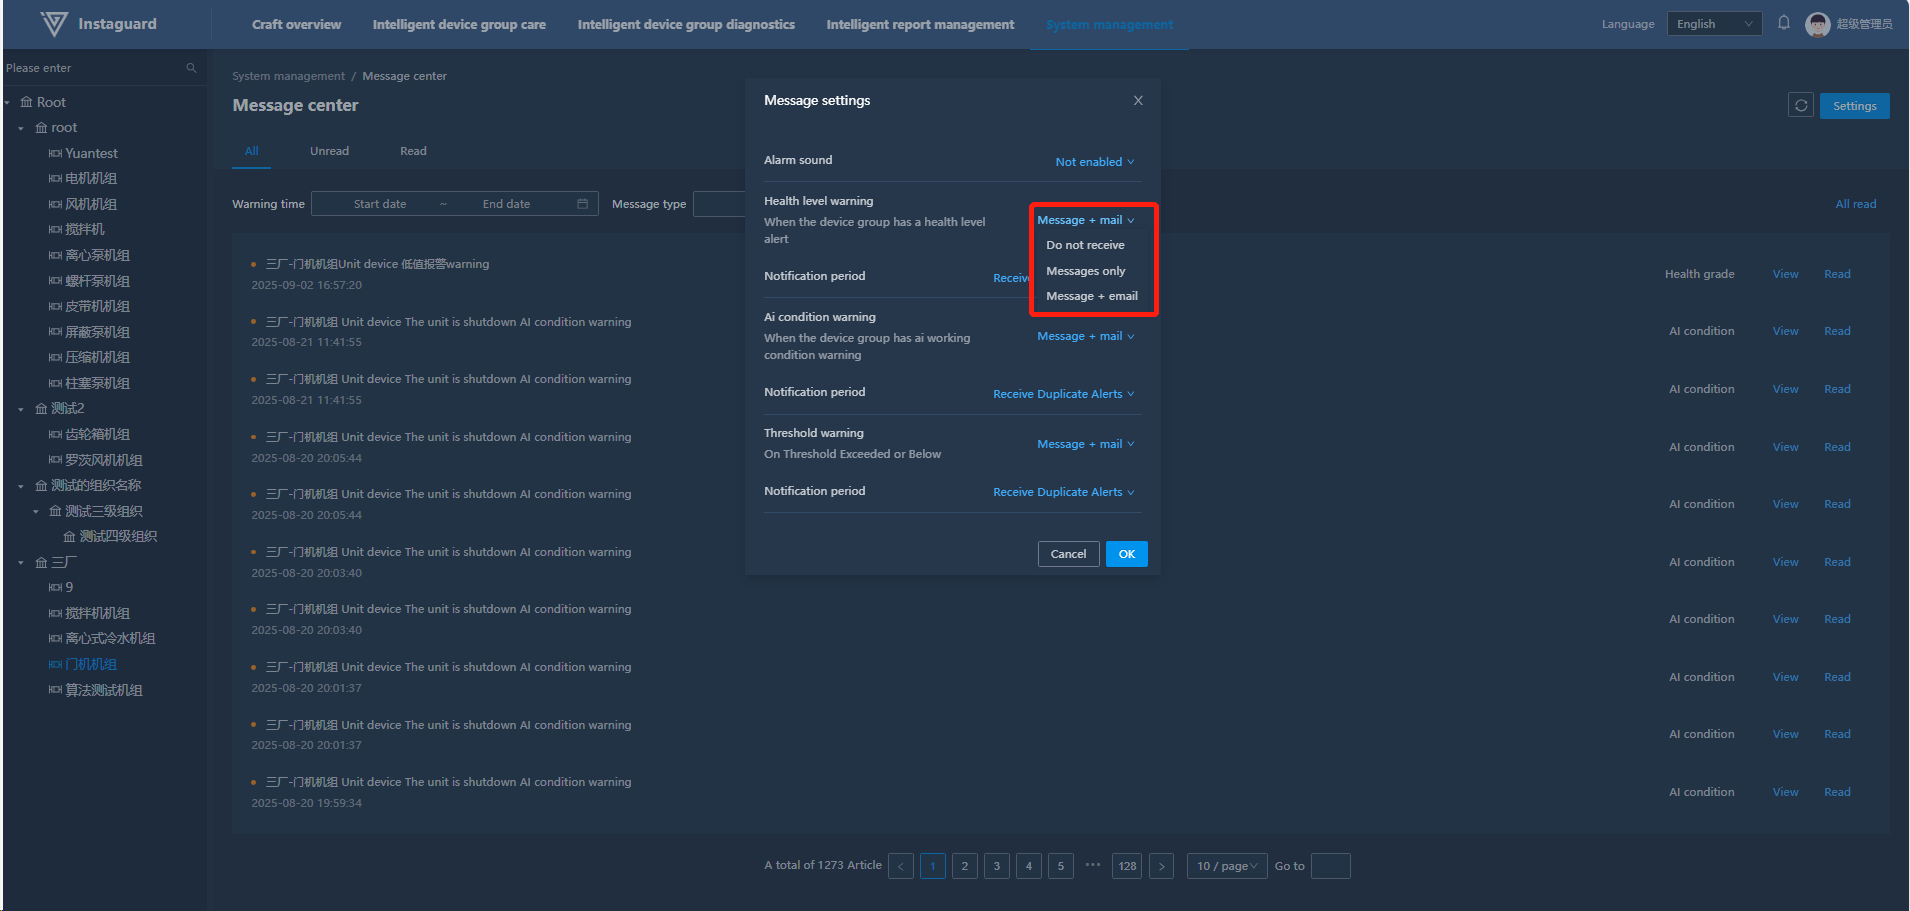
1.4 Message Settings
Click "Settings" at the upper-right to configure notification periods and methods for four message types:
- Notification periods: "When Occurs", "Every 6 Hours" (9:00, 15:00, 21:00, 3:00), "Daily" (9:00).
- Receiving methods: "Only Message", "Message + SMS + Email", "Do Not Receive".
1.5 Message Count Overview
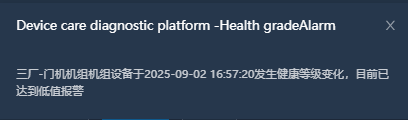
After setting cared units and enabling message reception, view unread message counts by type via the message icon next to the user avatar. Click to jump to the message management page.
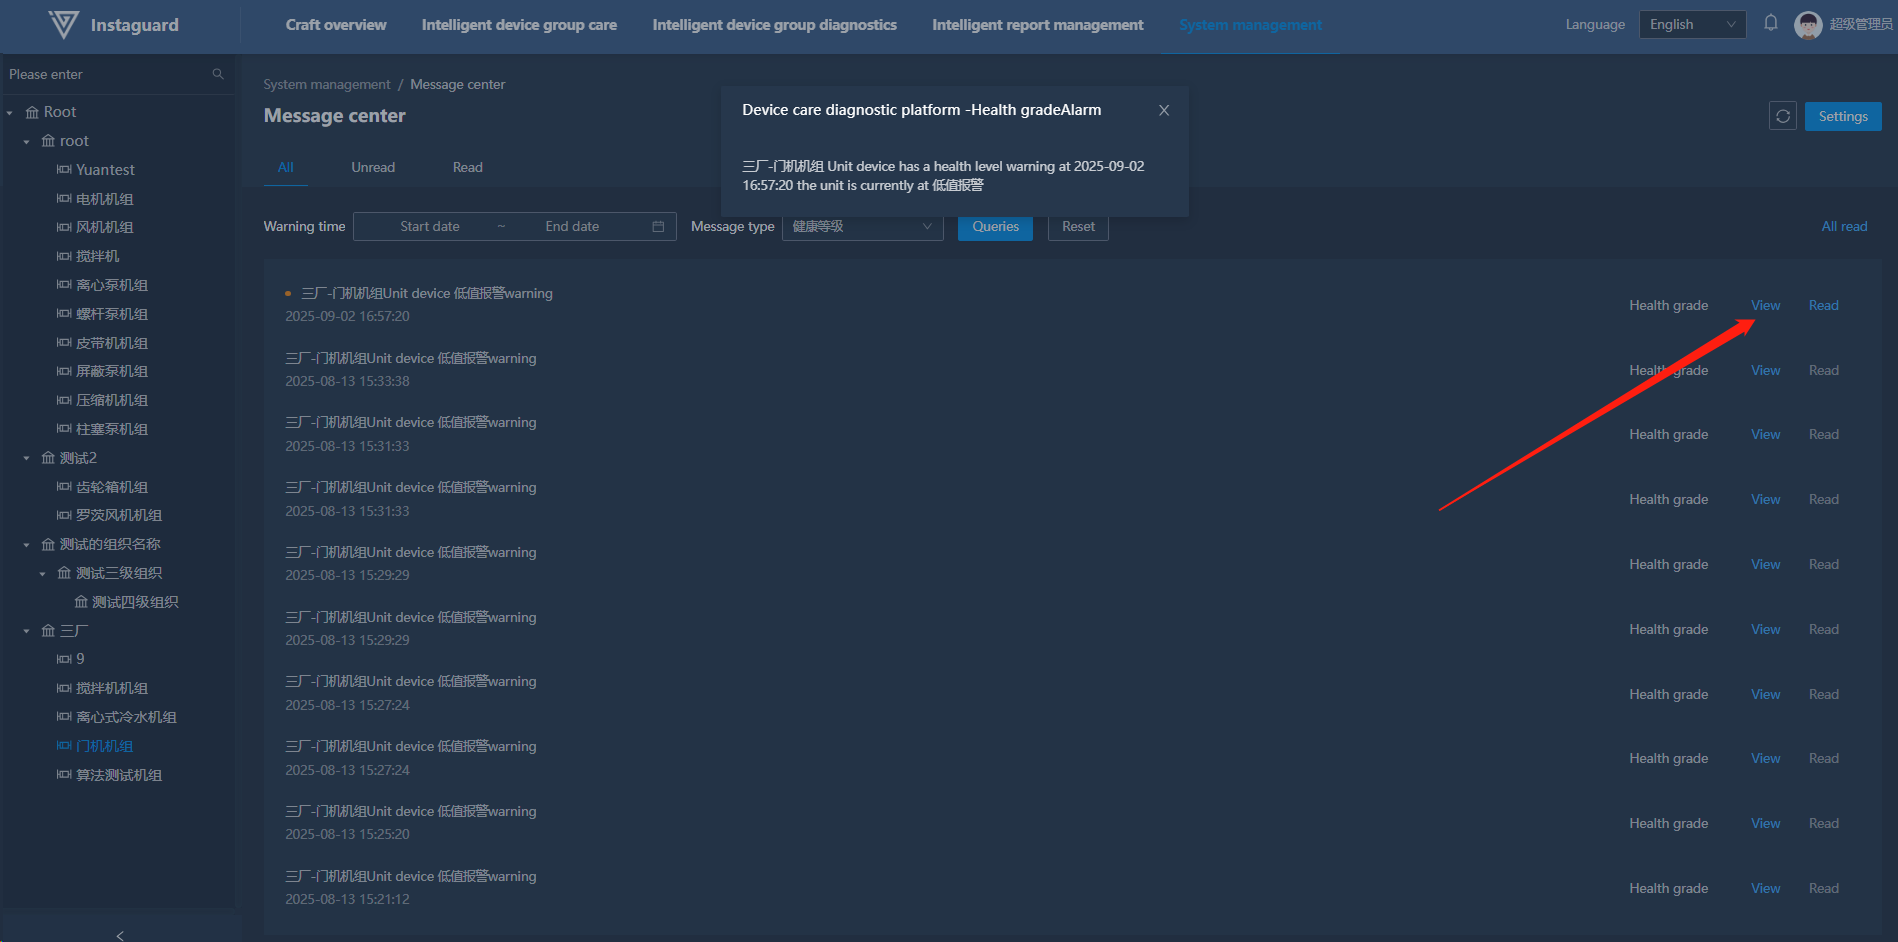
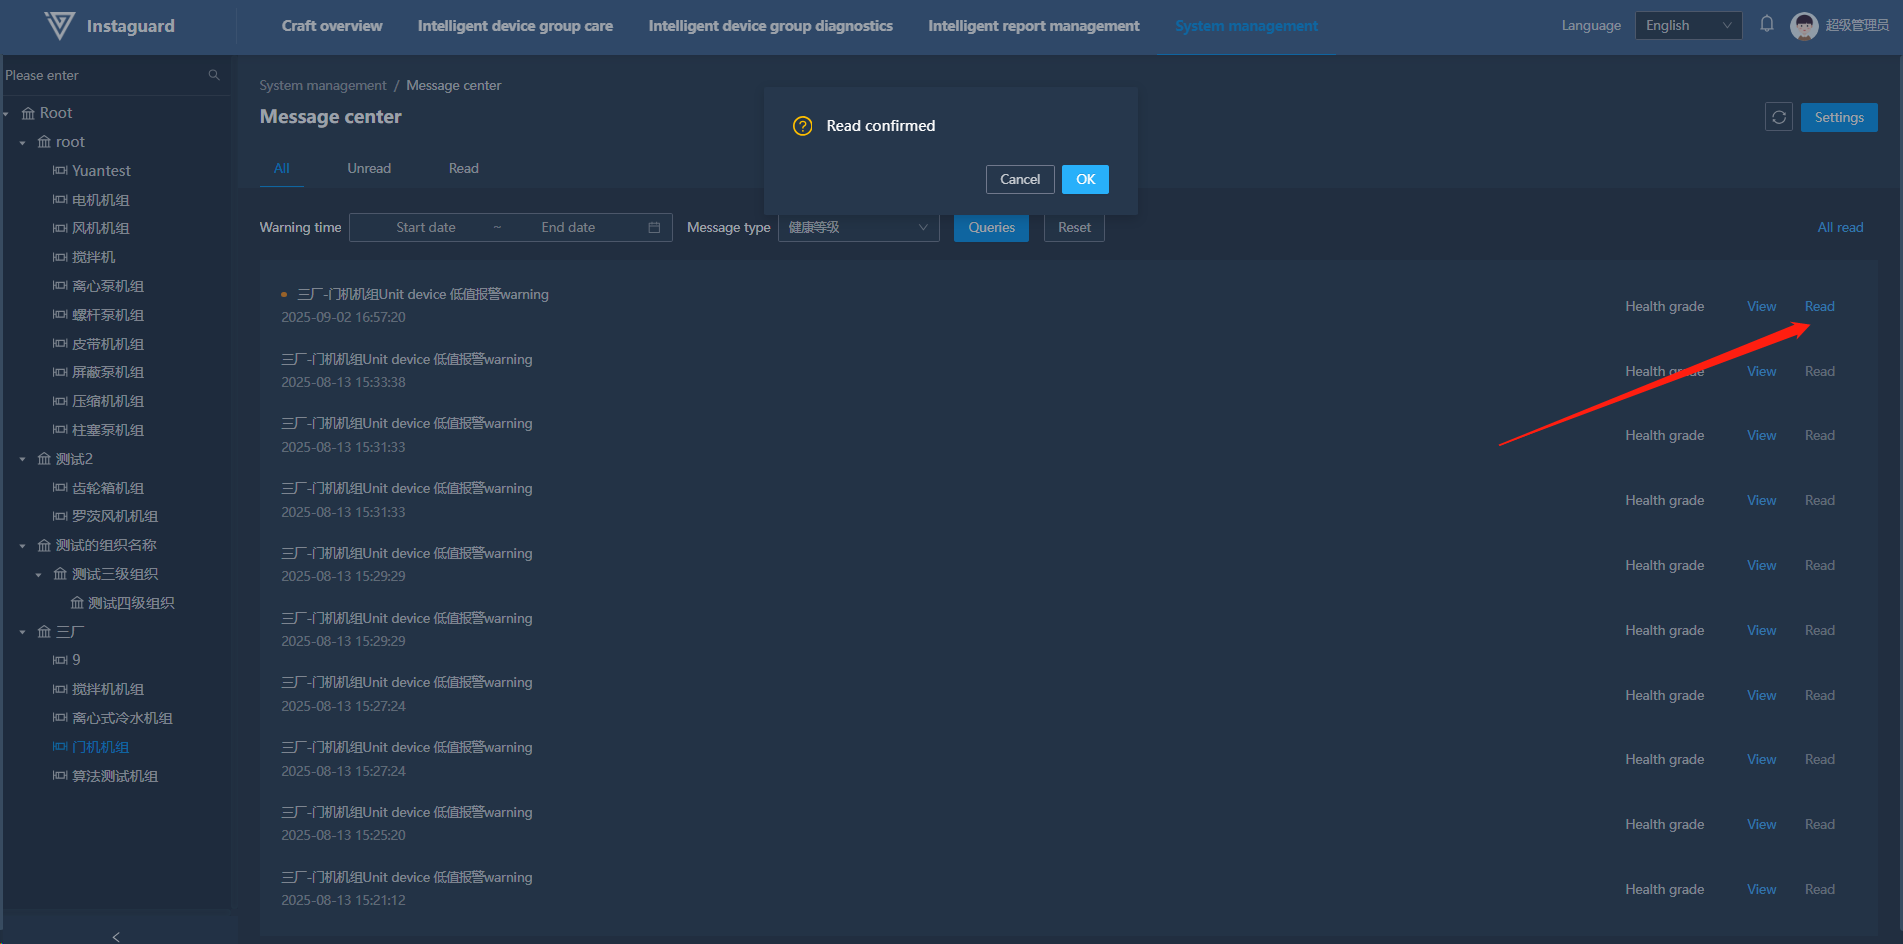
1.6 View/Mark as Read
Select a message and click "View" to show details, or "Mark as Read" to update its status.
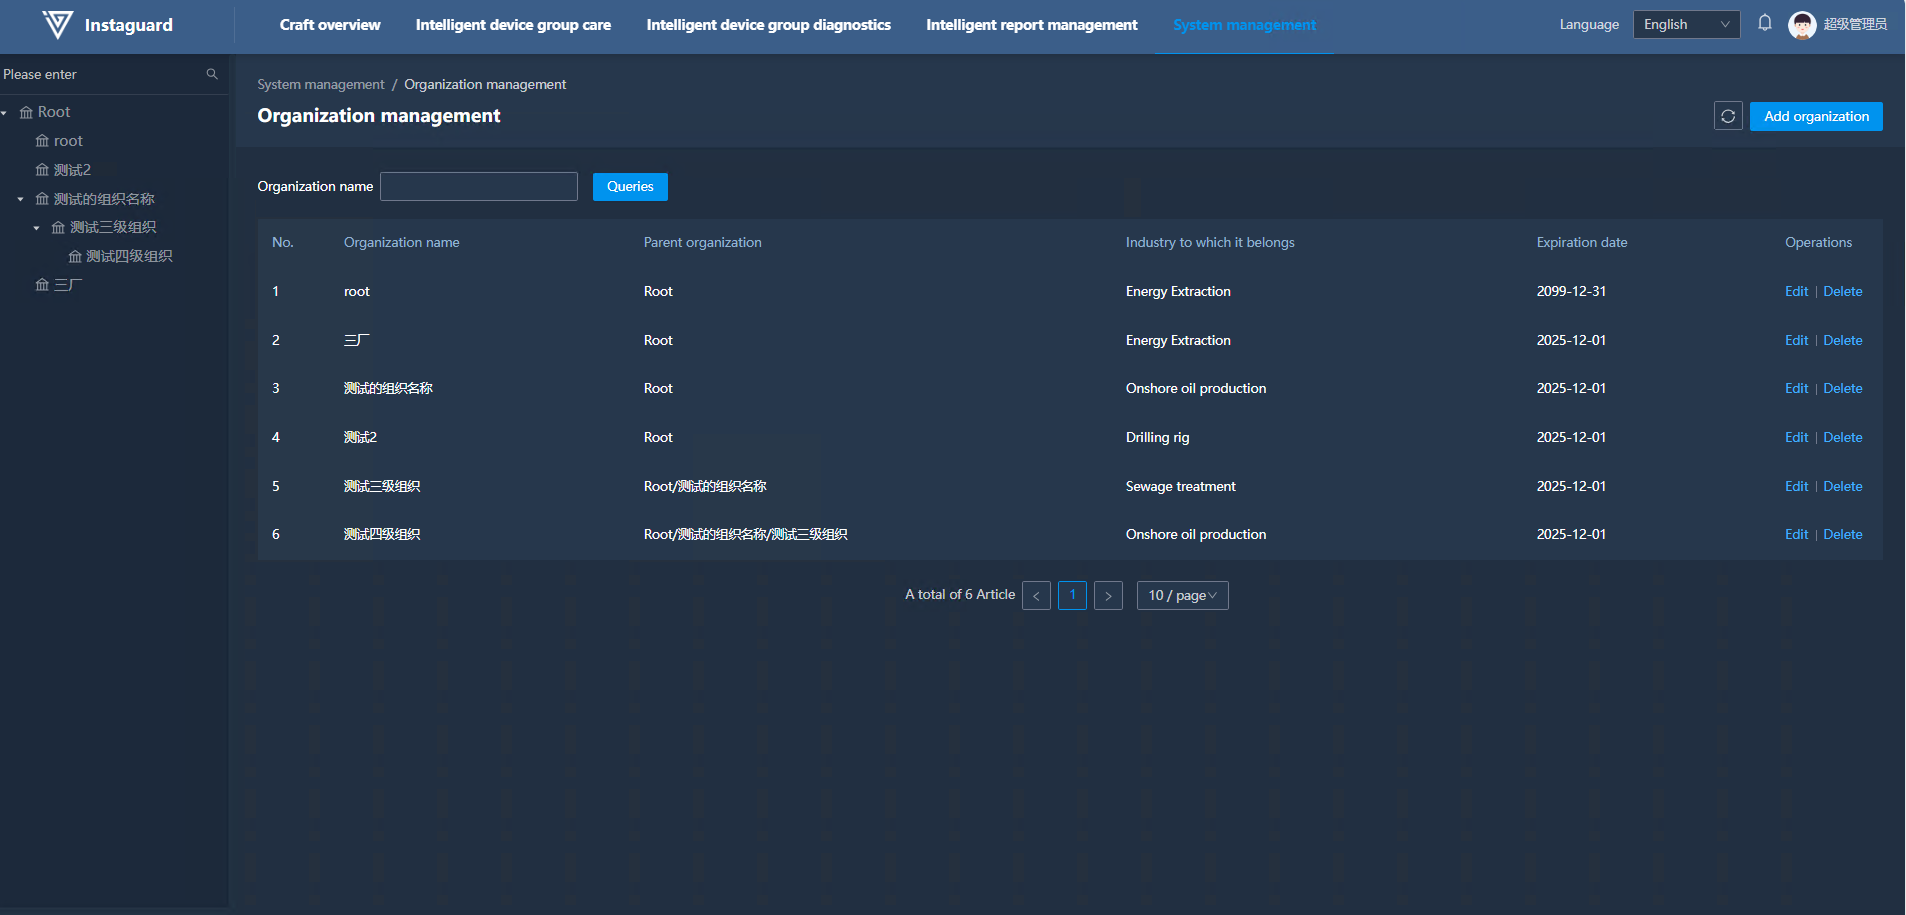
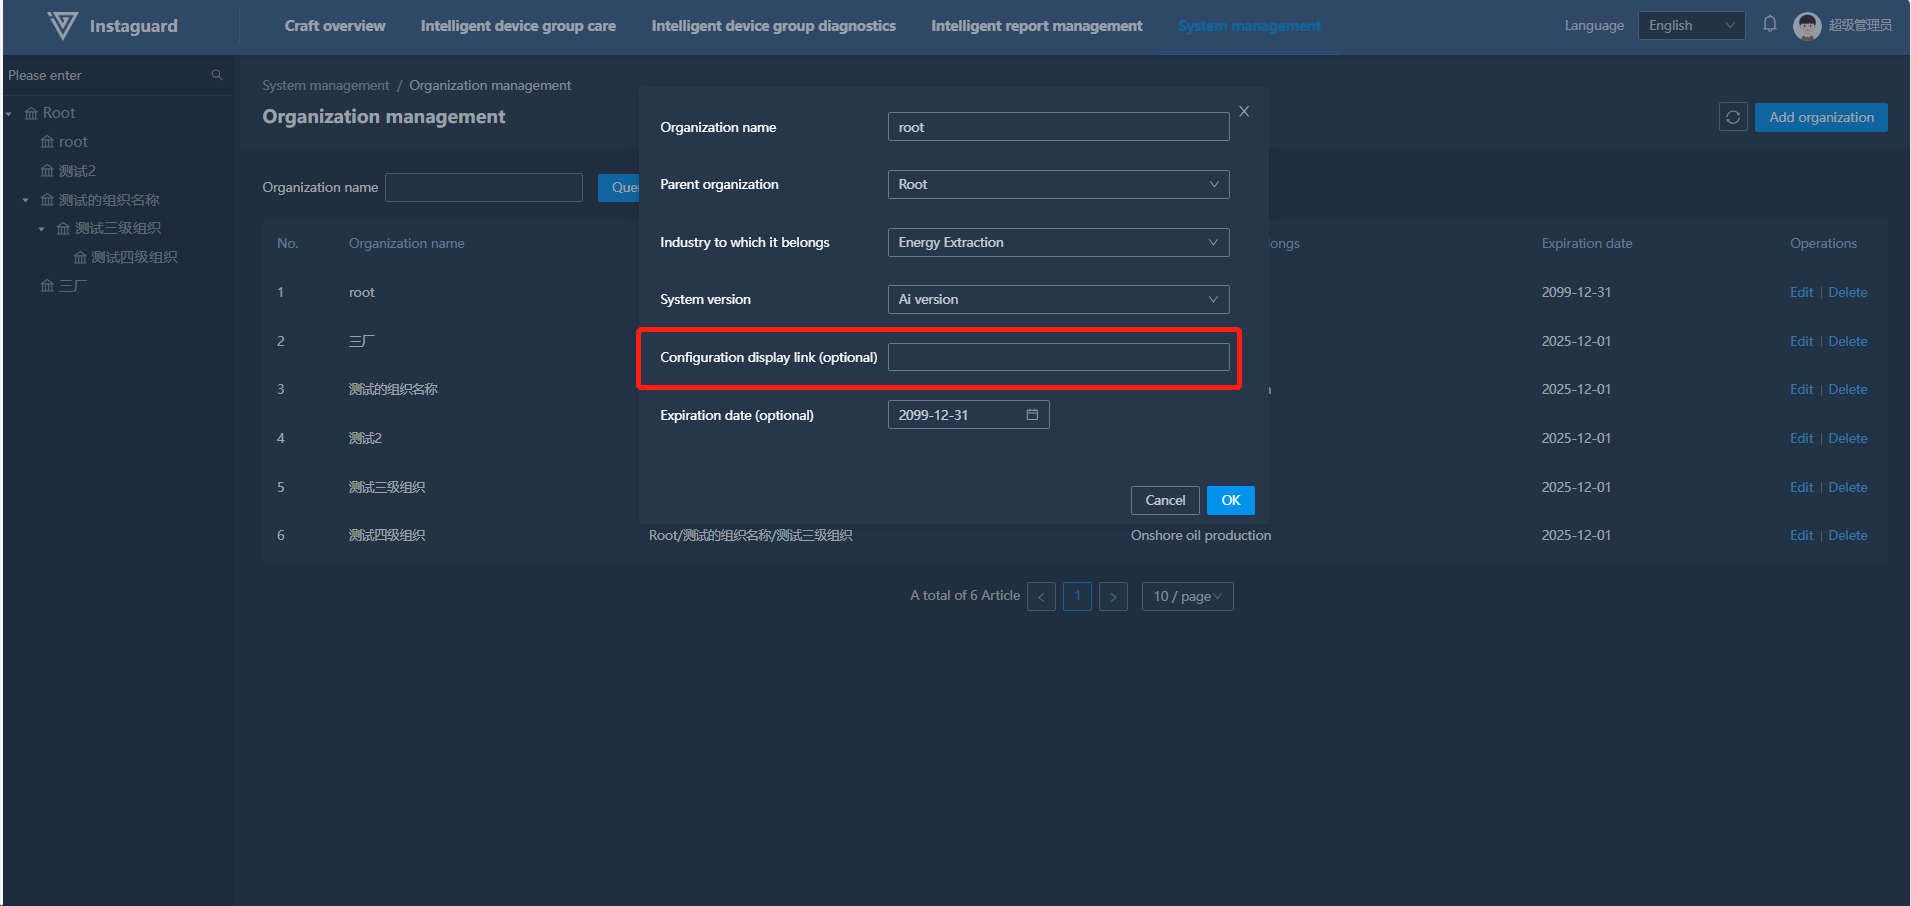
2. Organization Management
2.1 Navigation Path
「System Management」 → 「Organization Management」
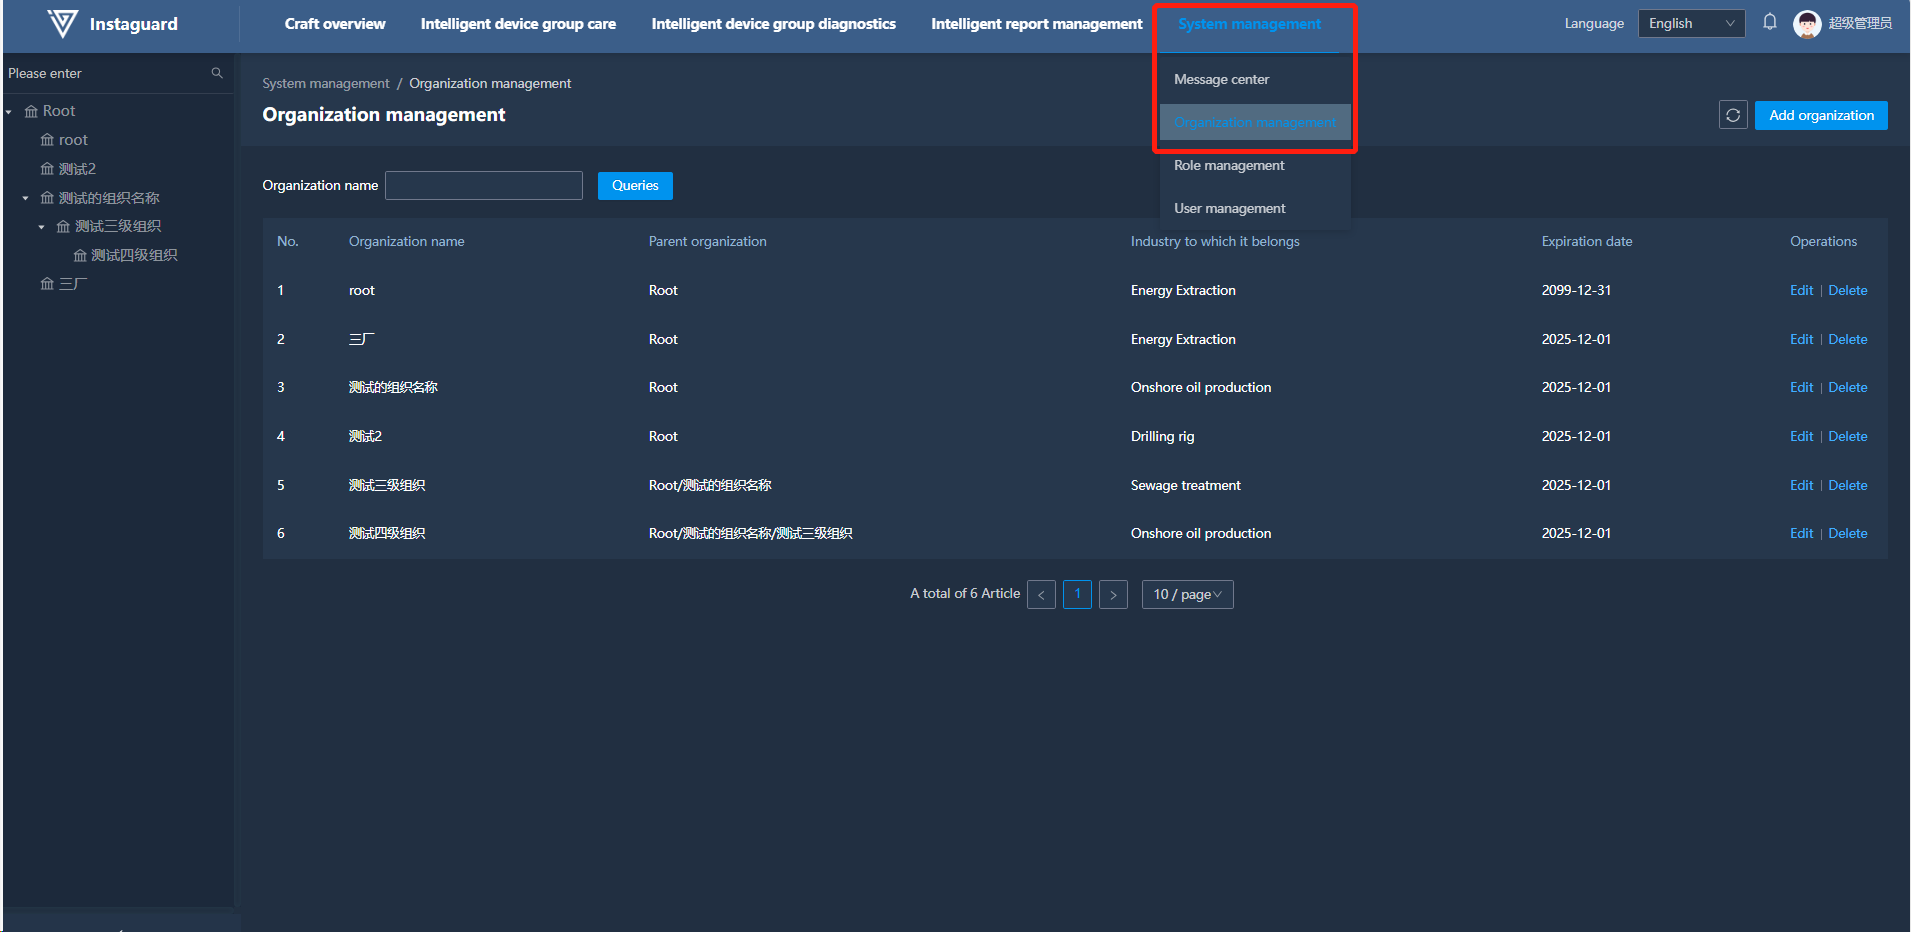
2.2 Function Overview
Add/delete organizations and adjust their position in the organization tree. Sub-organization names must be unique under the same parent organization.
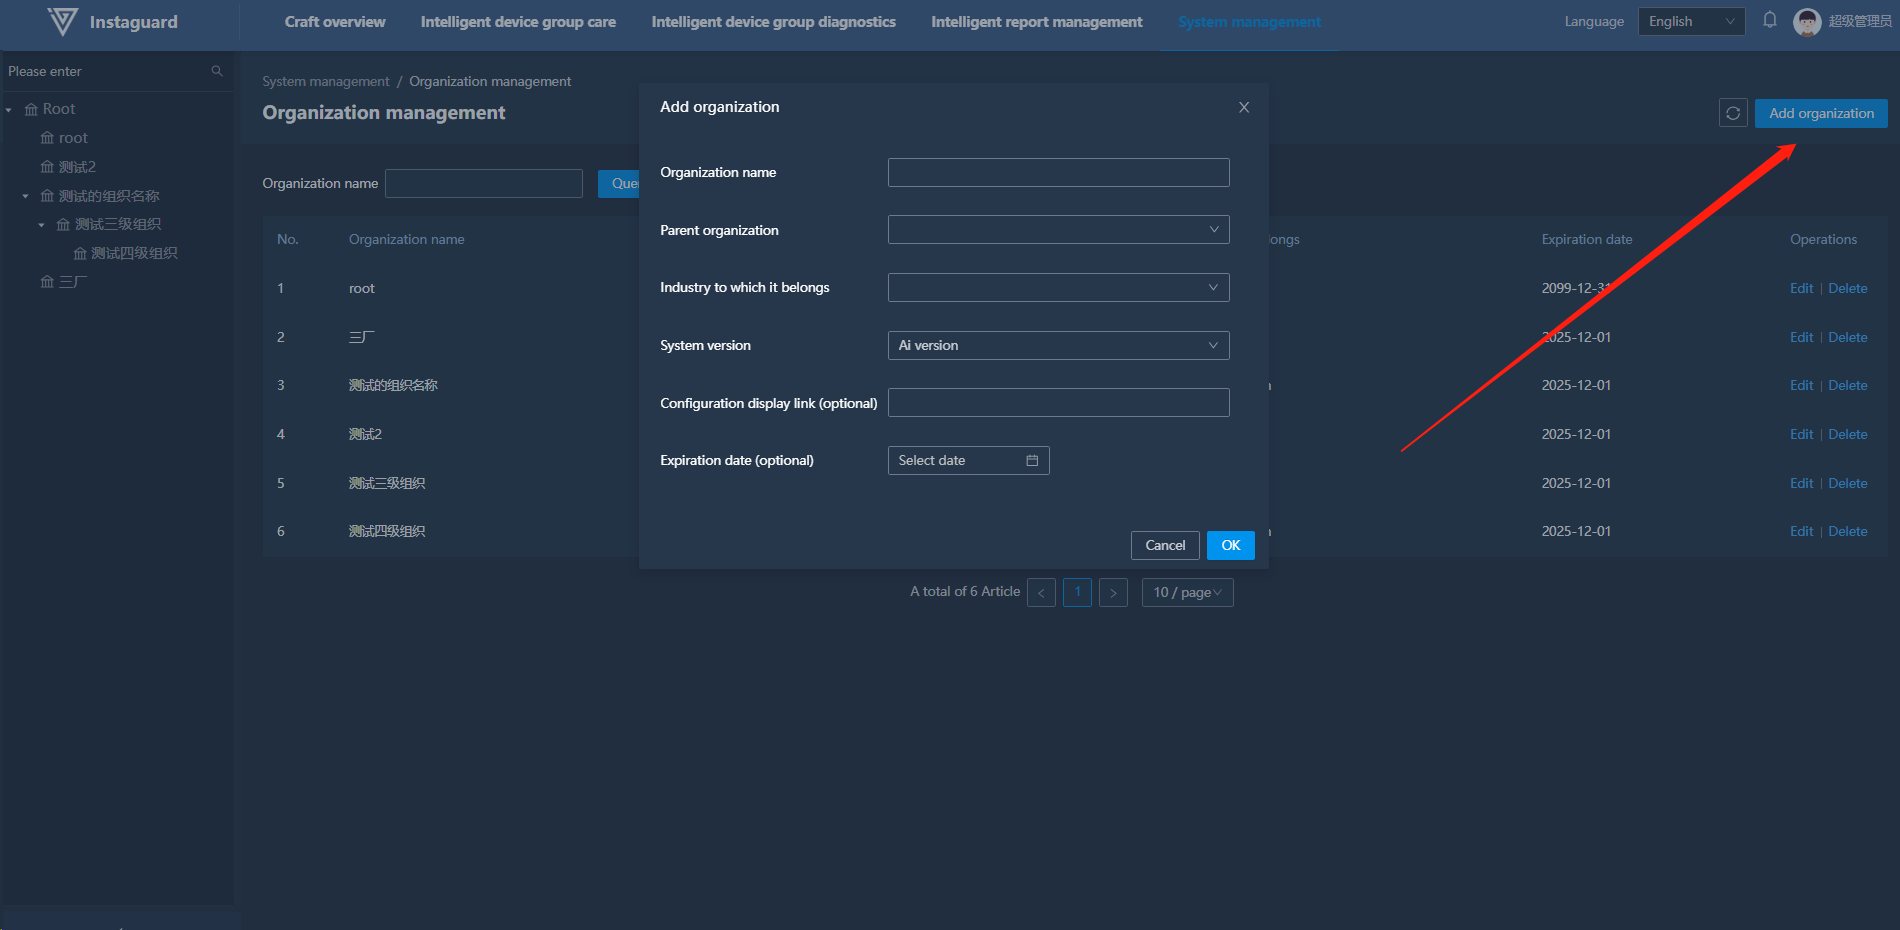
2.3 Adding Organizations
Click "Add Organization" at the upper-right in Organization Management to open the addition page.
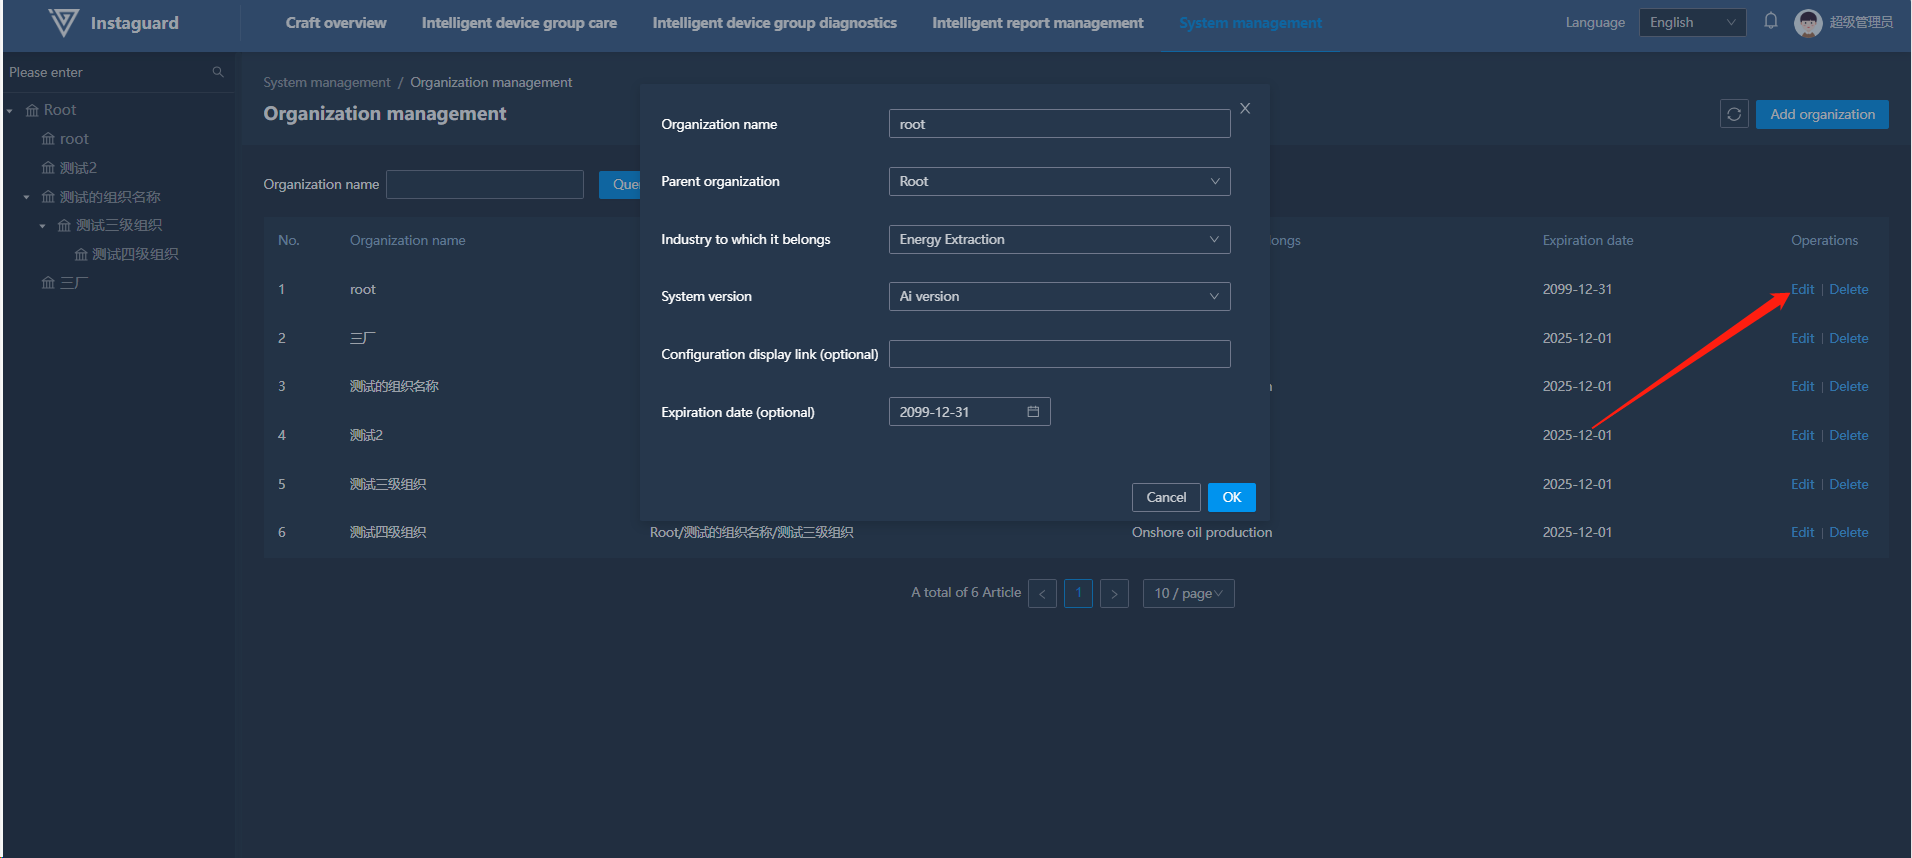
2.4 Editing Organizations
Click "Edit" for an organization to open the editing page (sub-organization names must be unique).
2.5 Configuration Address Editing
Enter the configuration chart URL (drawn by Instaguard or third-party) in "Configuration Display Link" when editing an organization. Saved configurations will display in the process configuration page.
3. Role Management
3.1 Navigation Path
「System Management」 → 「Role Management」
3.2 Adding Roles
Click "Add Role" at the upper-right in Role Management to open the addition page (roles belong to selected organizations, with unique names and customizable permissions).
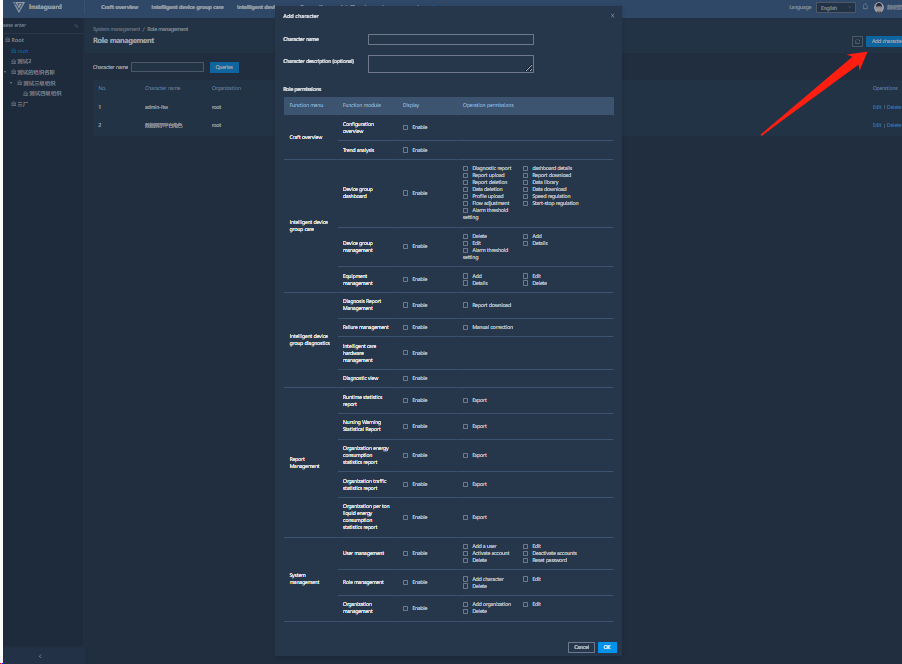
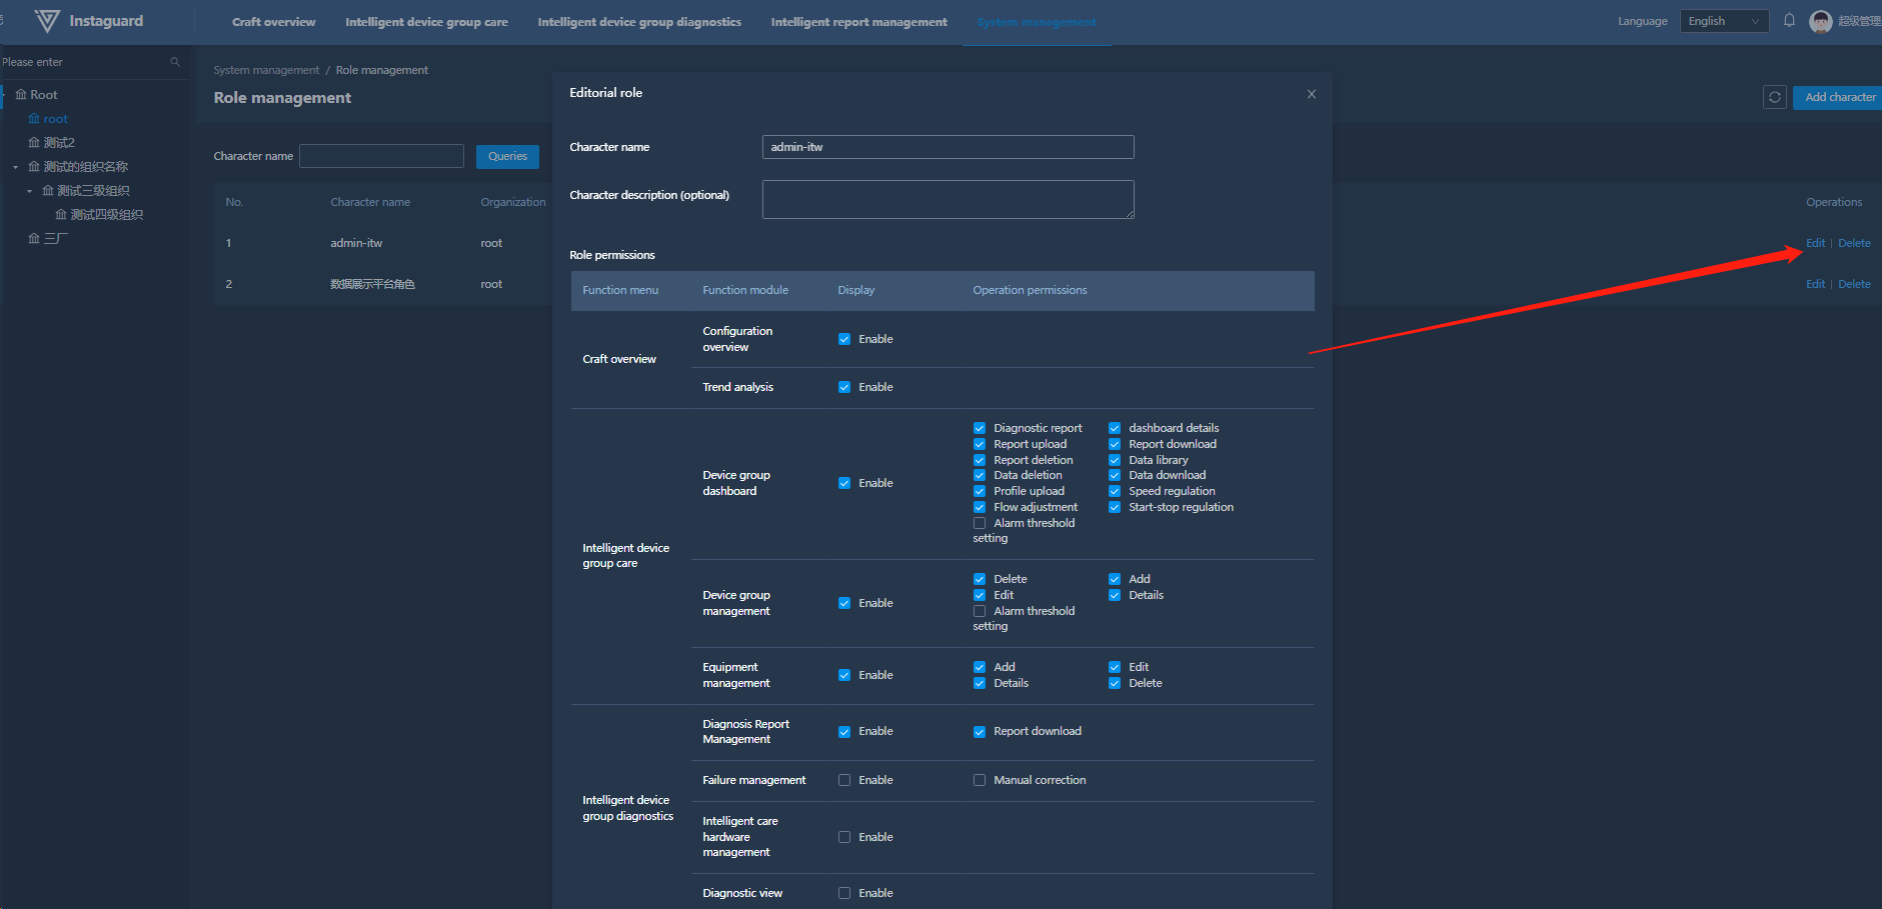
3.3 Editing Roles
Click "Edit" for a role to modify its permissions (role names must be unique).
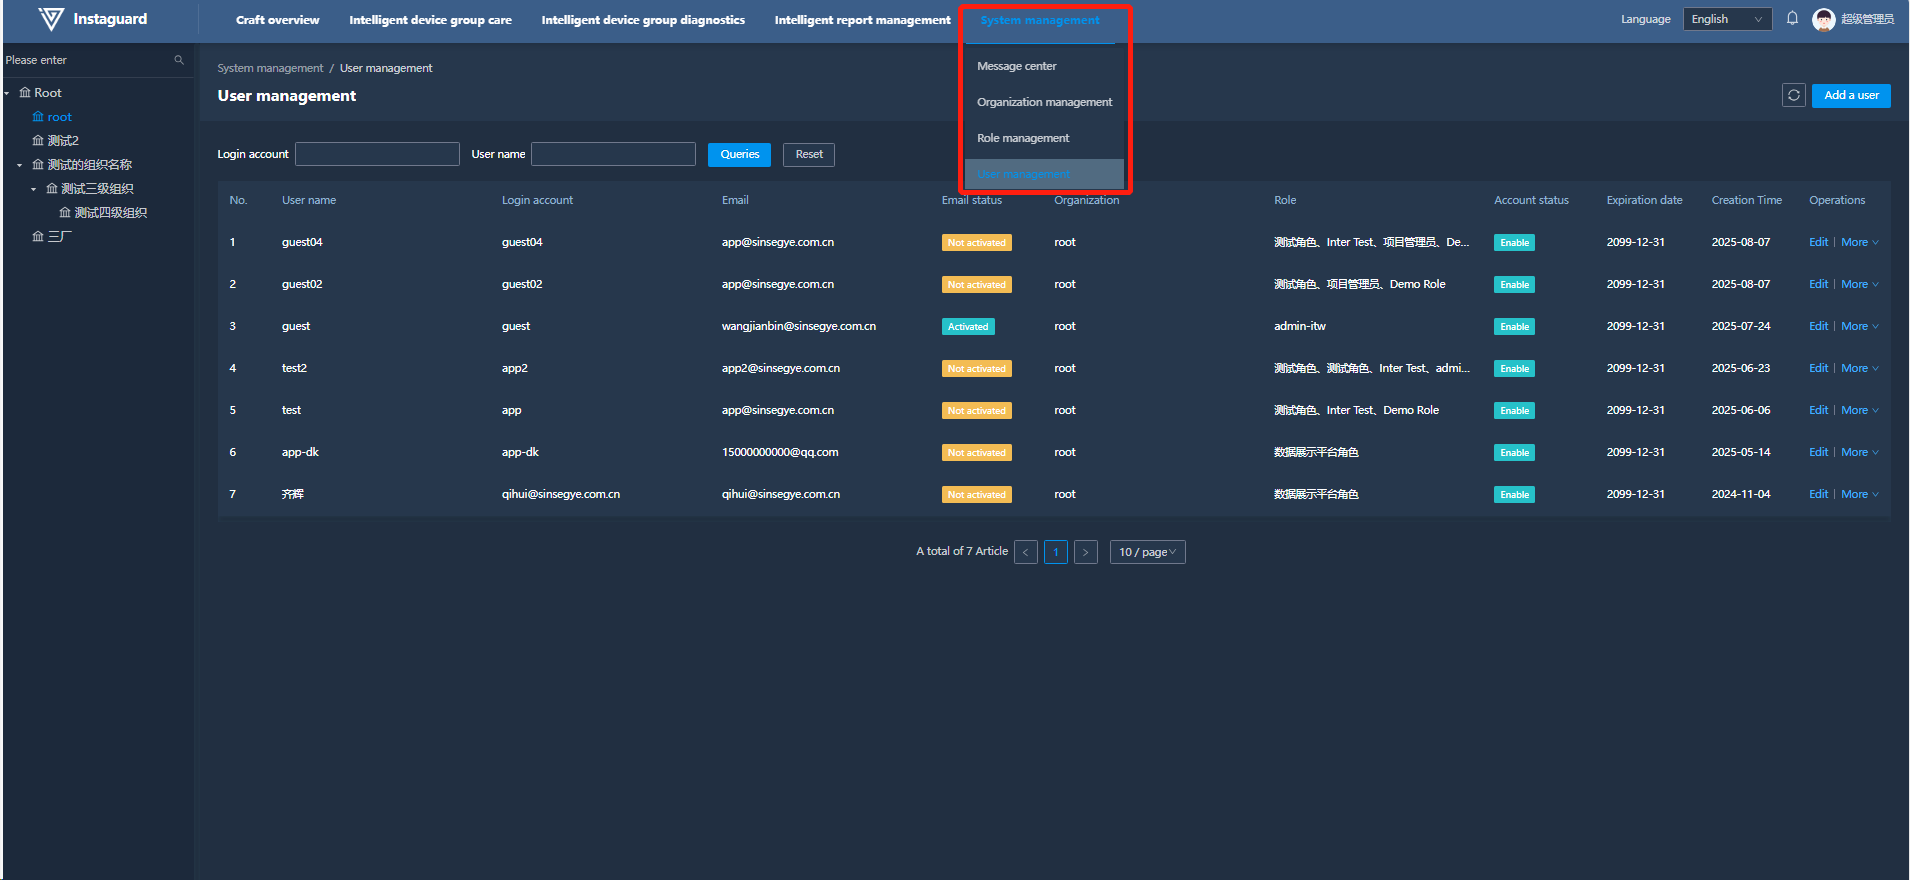
4. User Management
4.1 Navigation Path
「System Management」 → 「User Management」
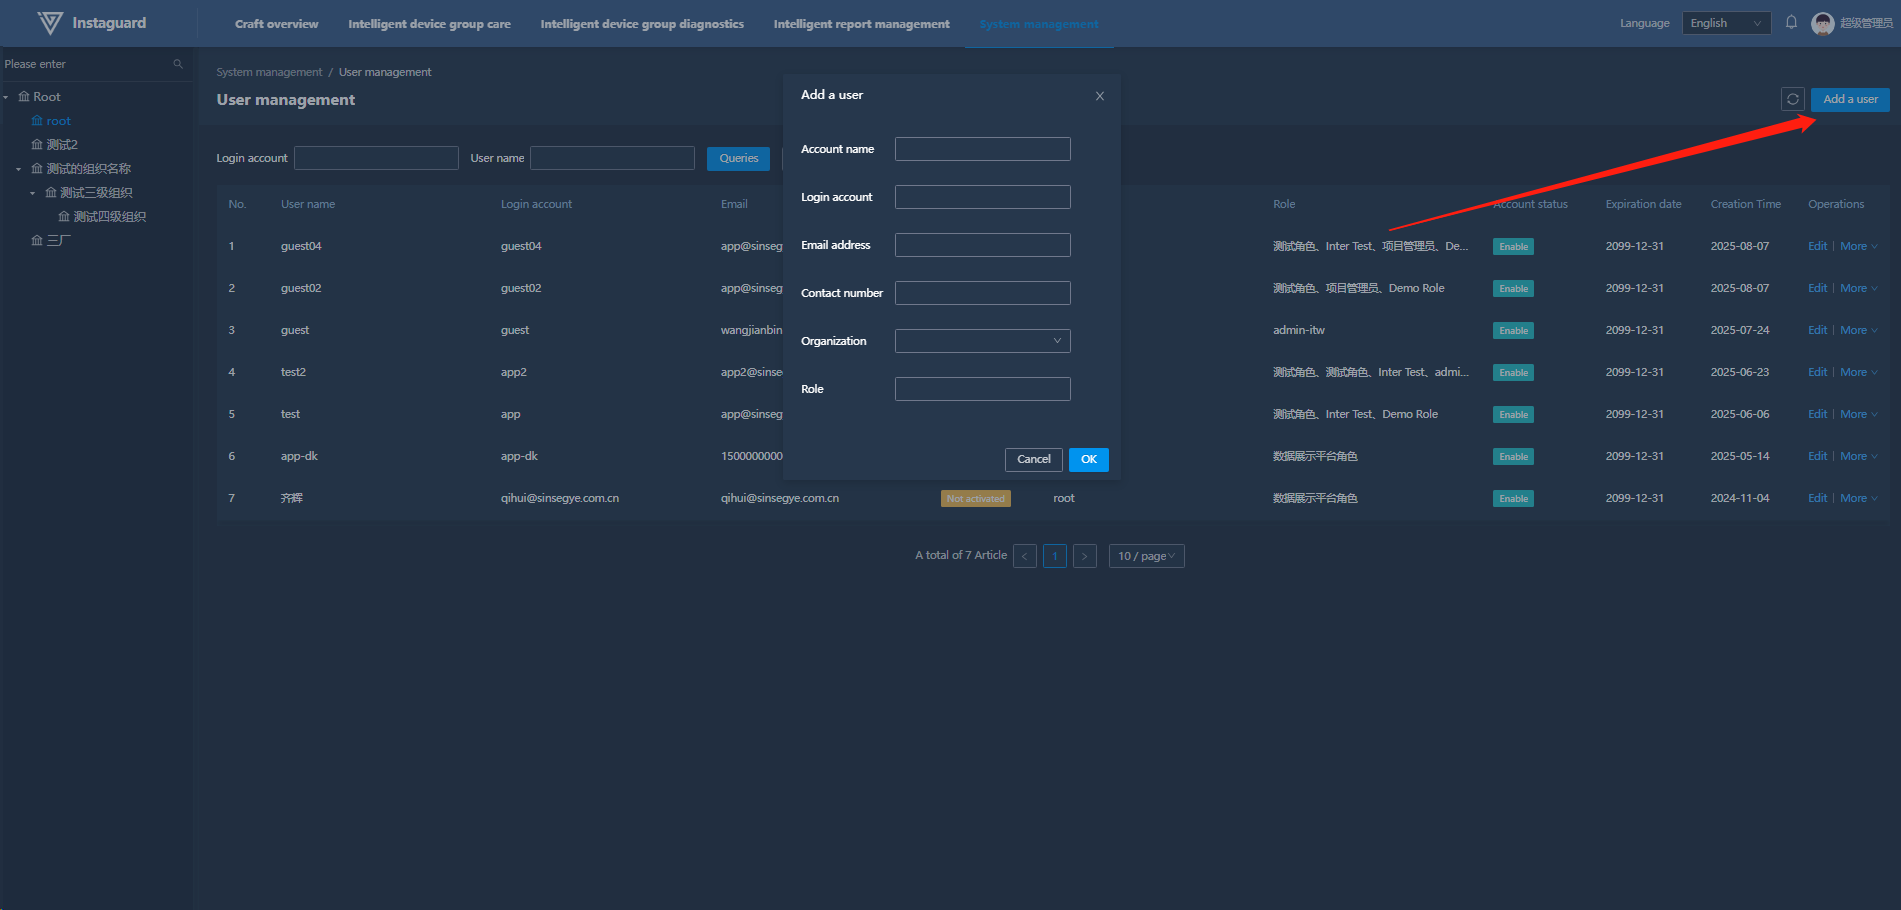
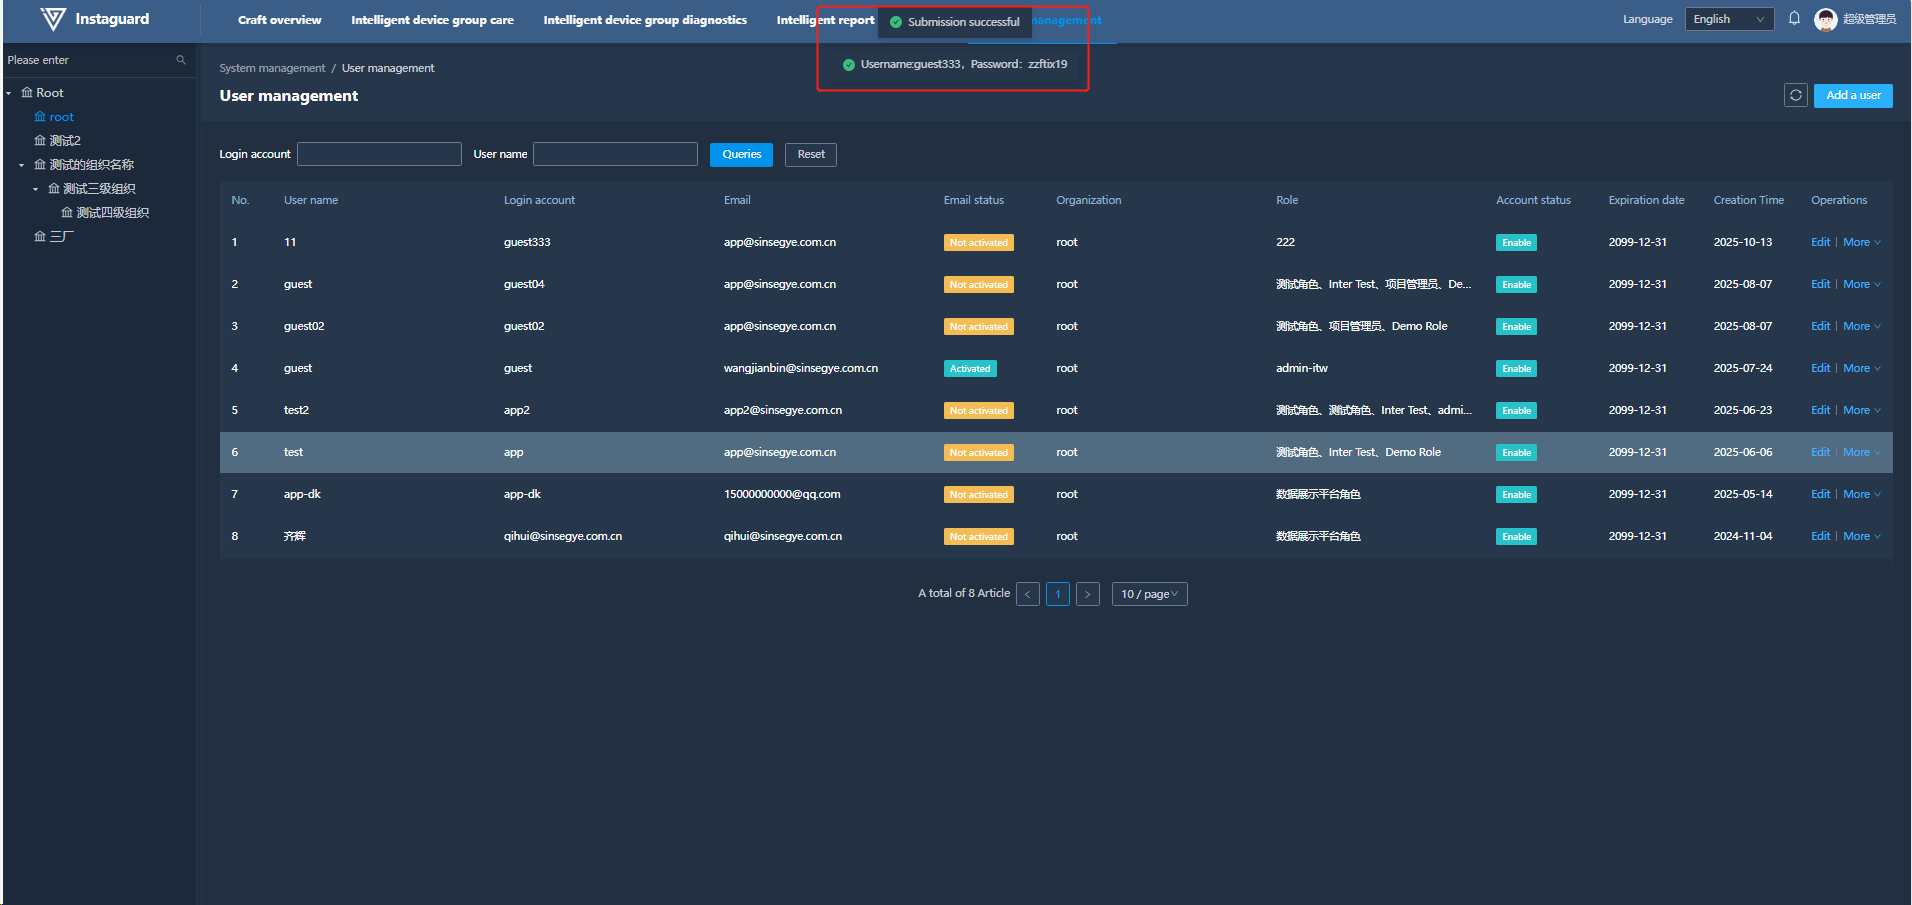
4.2 Adding Users
Click "Add User" at the upper-right in User Management to open the addition page (login accounts are unique, ≥8 characters).
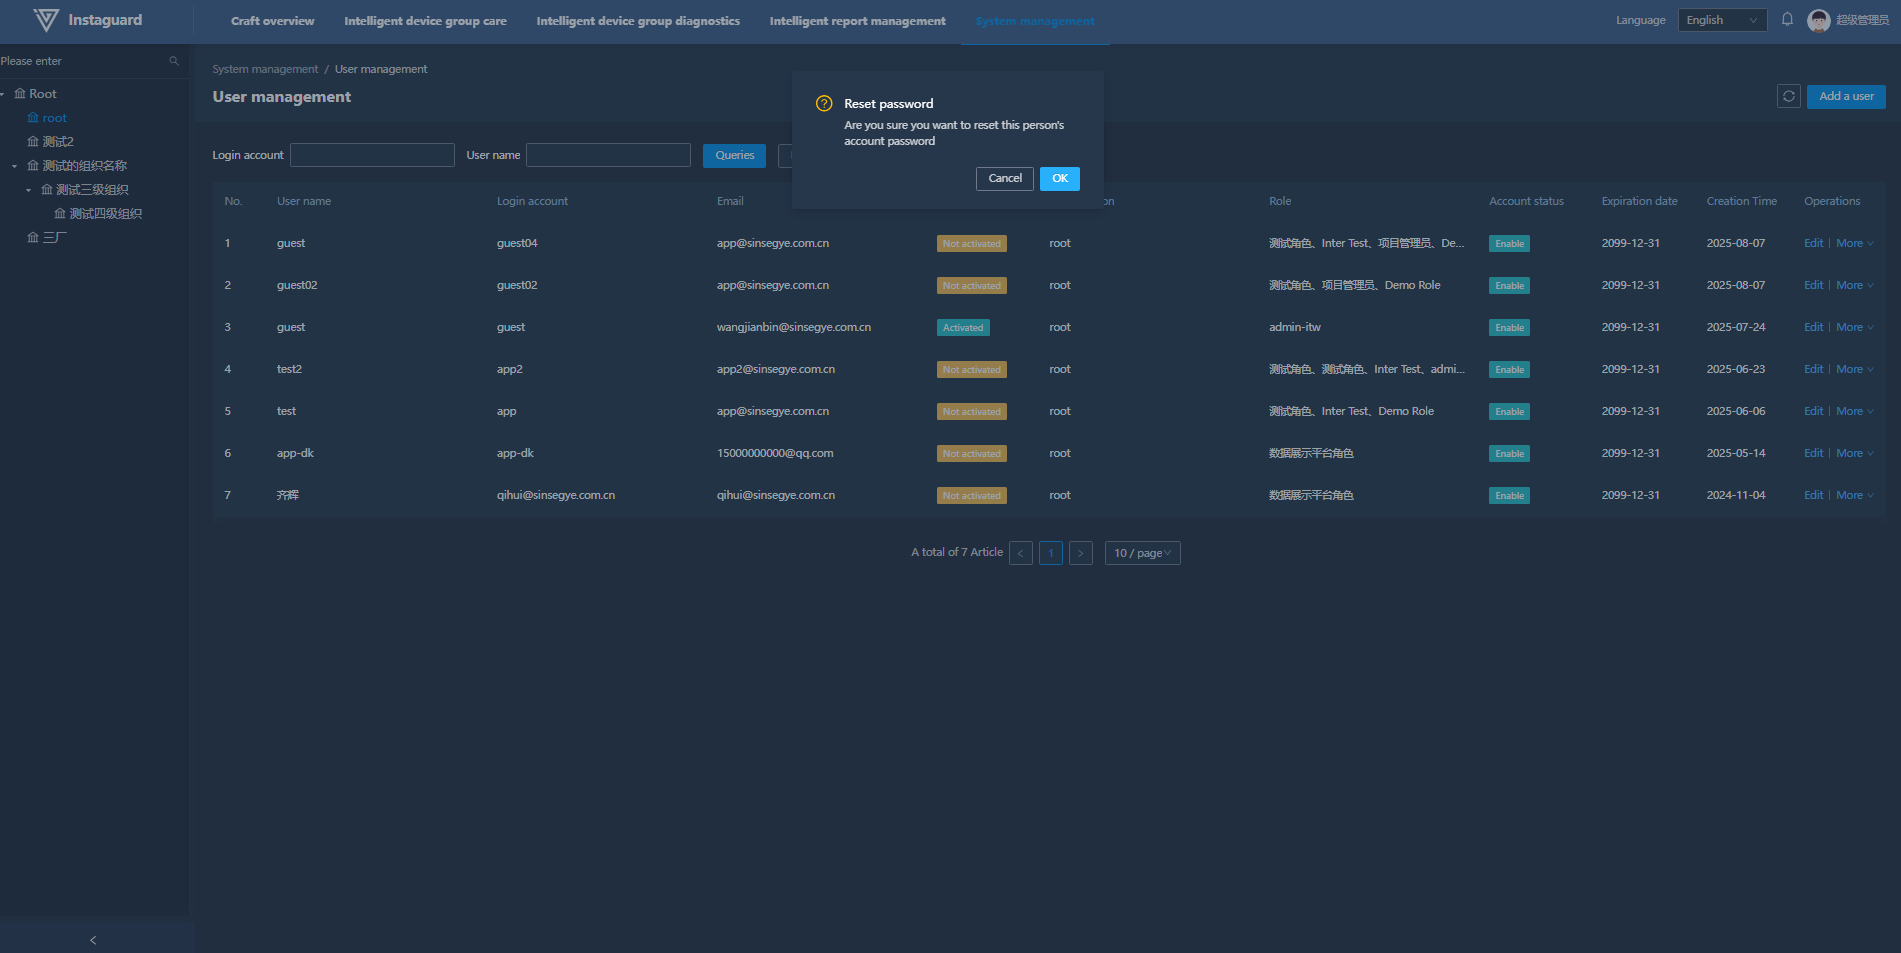
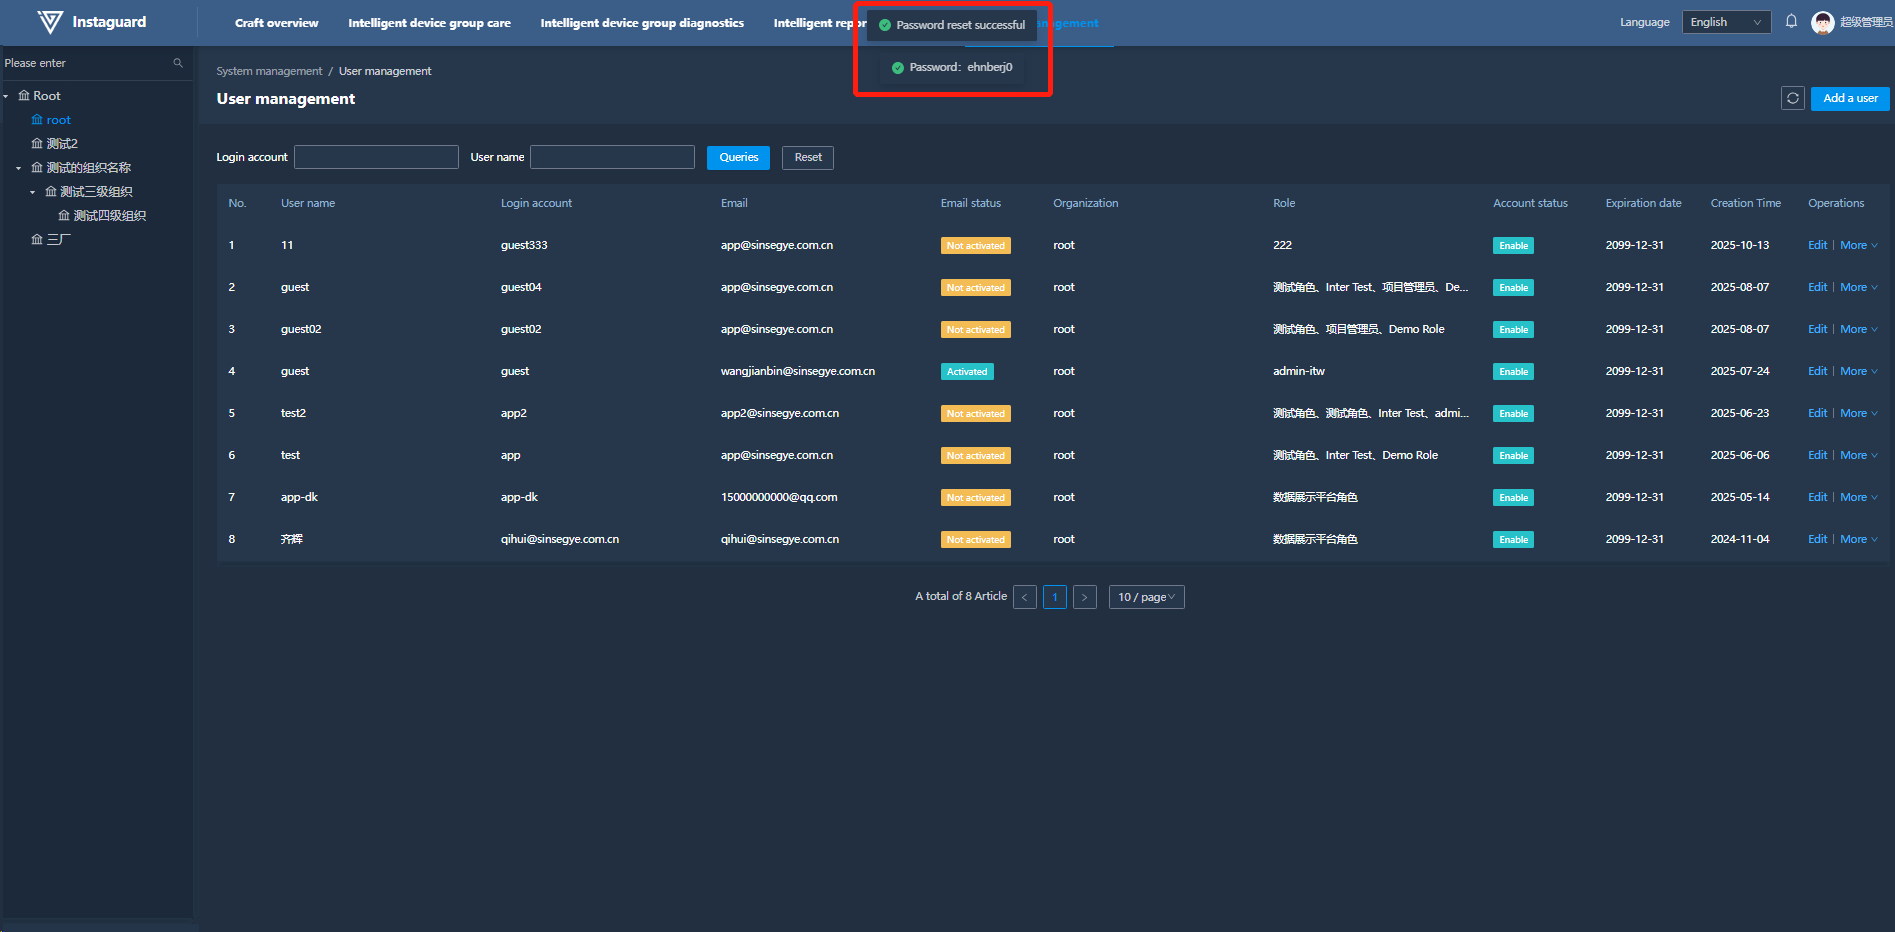
4.3 Resetting Passwords
Click "Reset Password" for a user to reset their password.
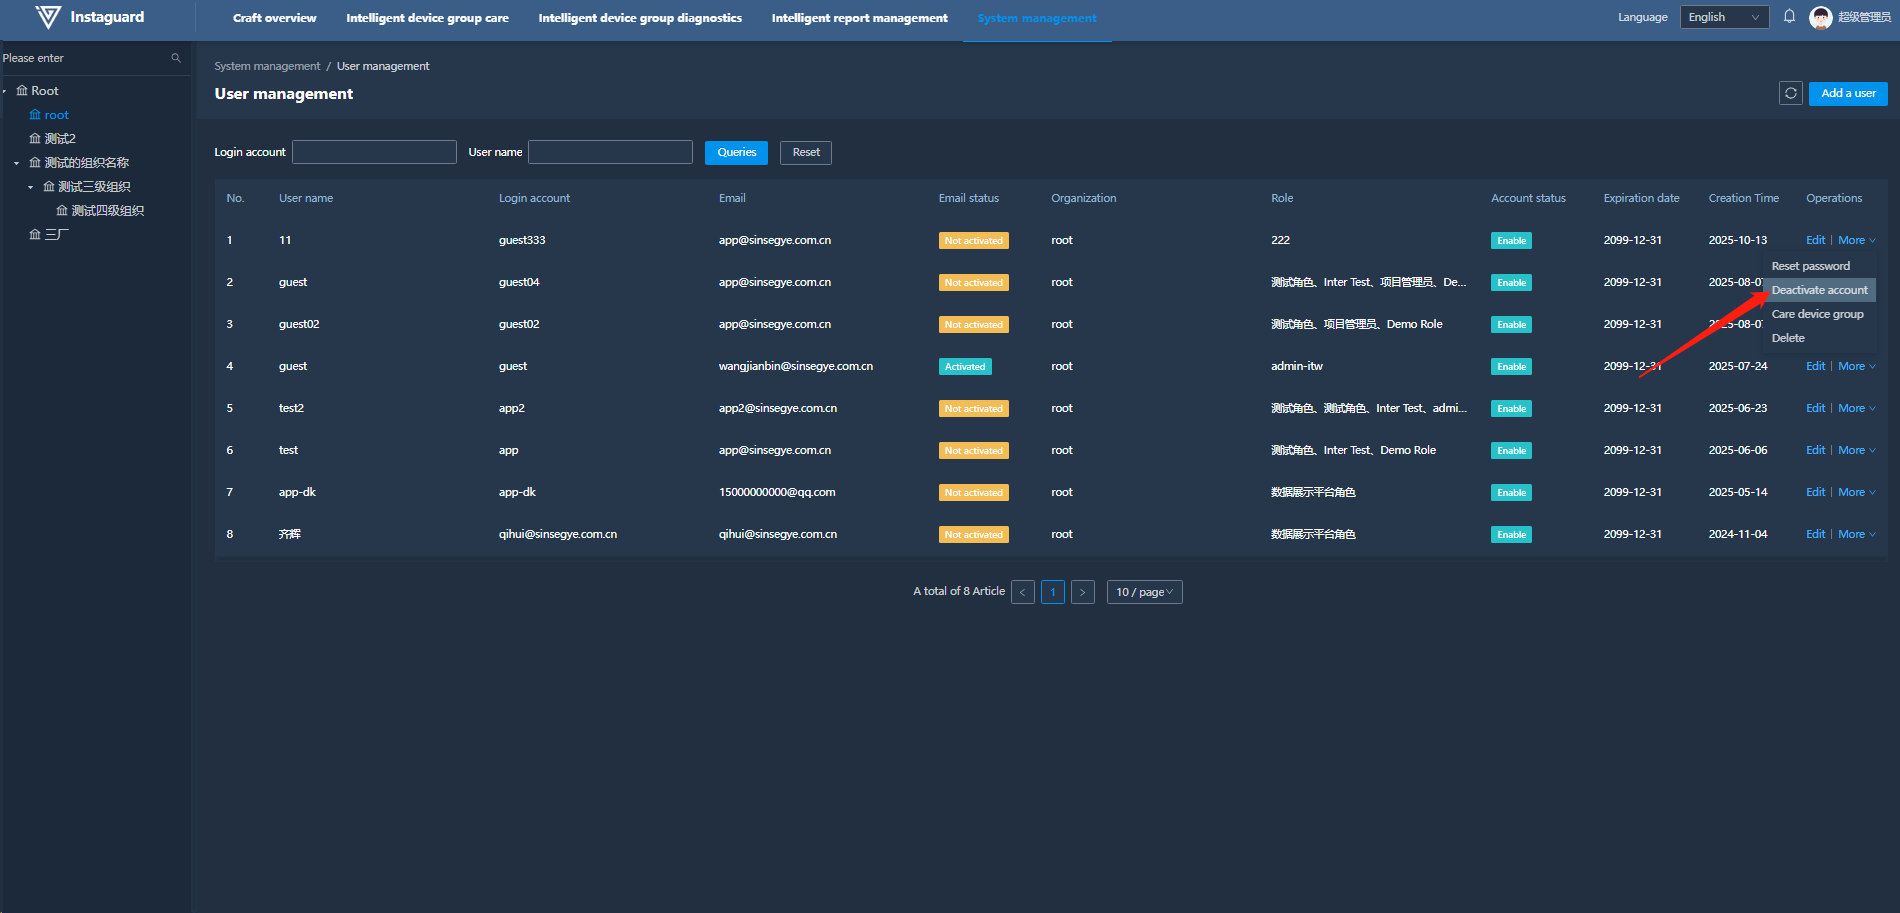
4.4 Disabling Accounts
Click "Disable Account" for an enabled account to disable it.
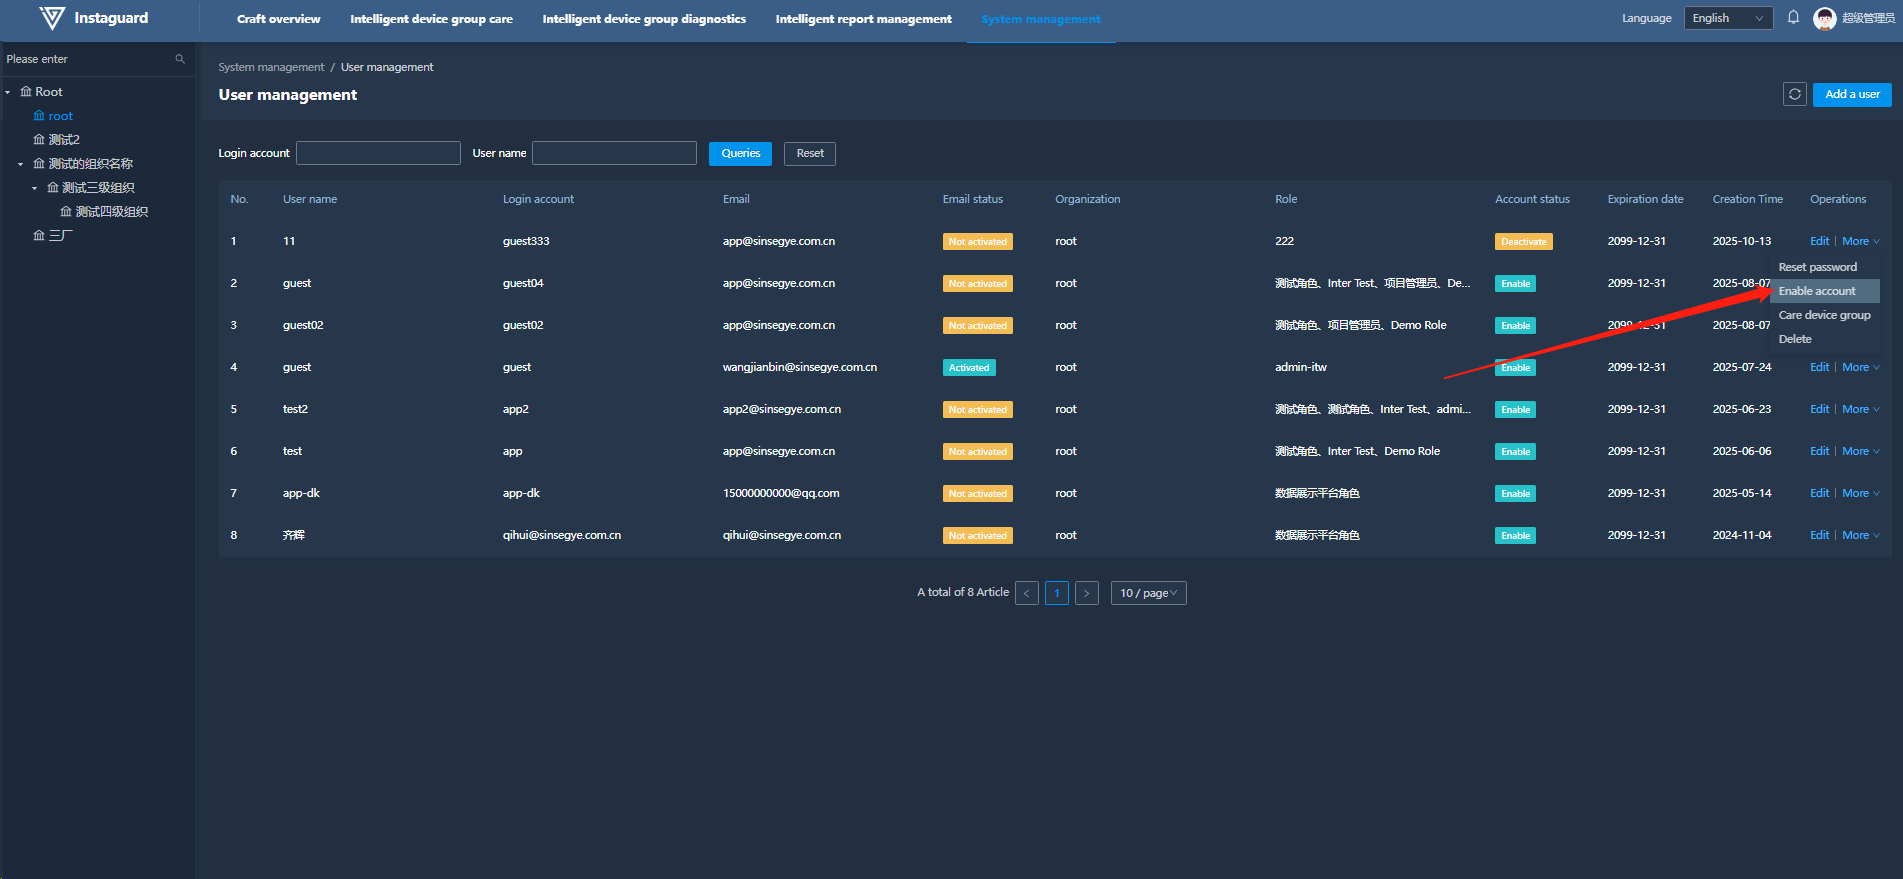
4.5 Enabling Accounts
Click "Enable Account" for a disabled account to re-enable it.
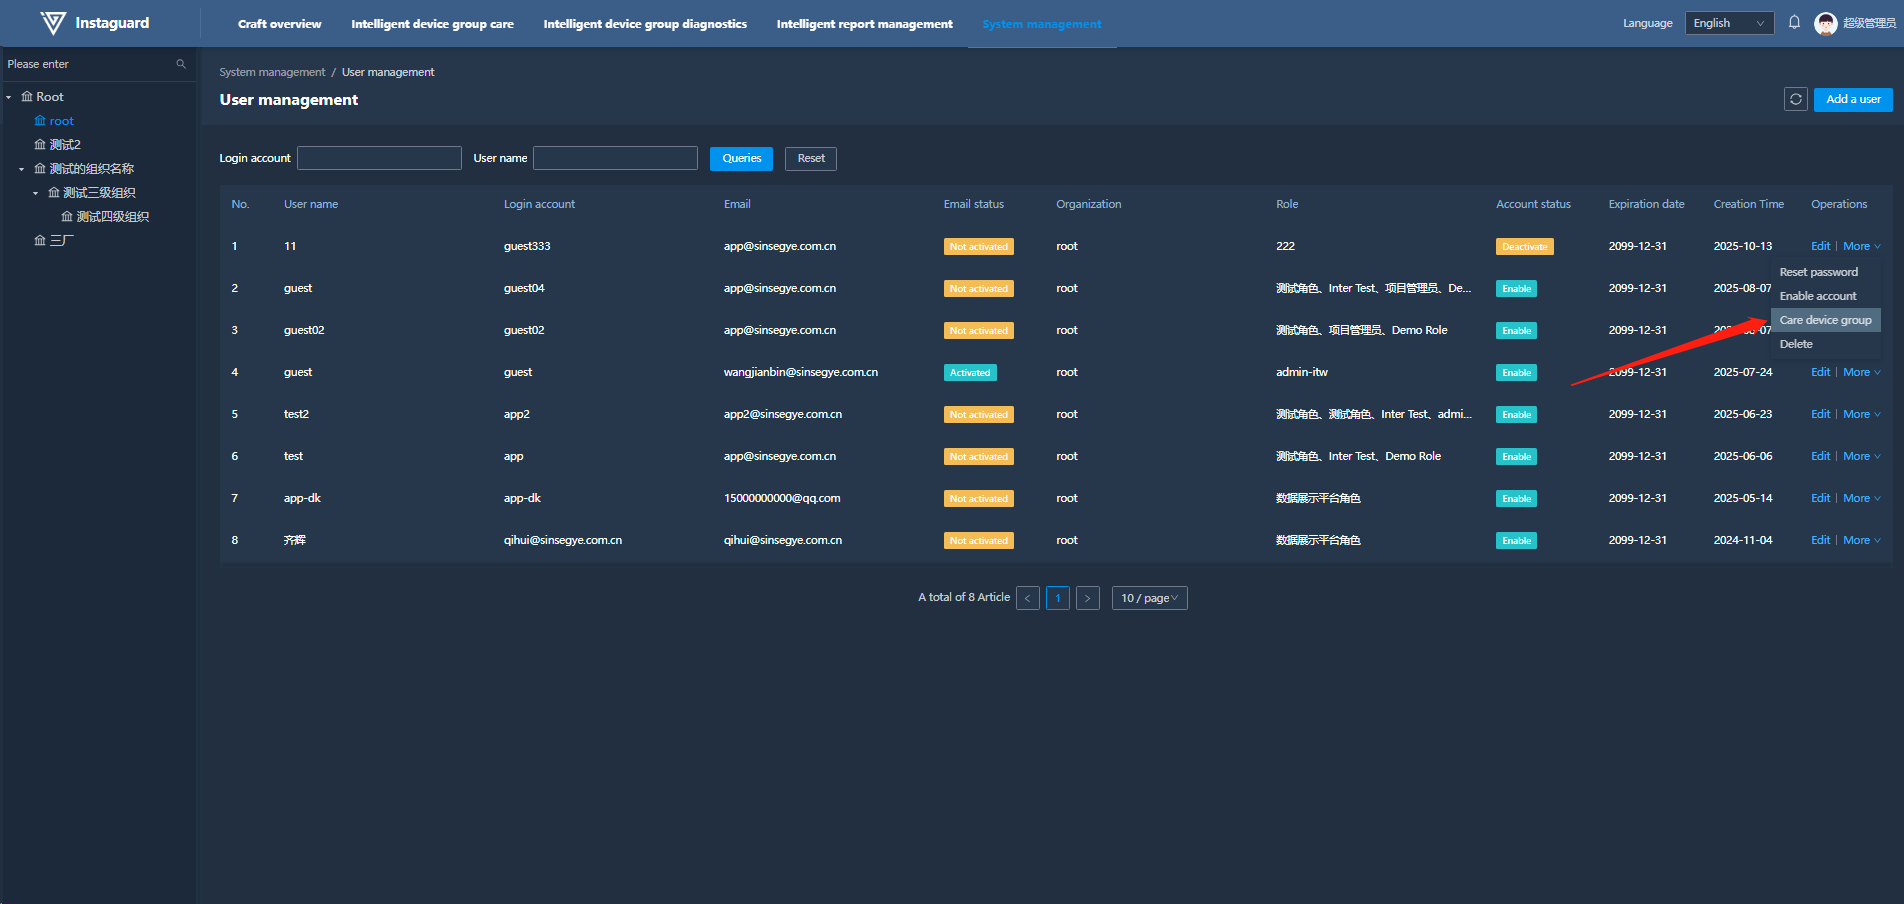
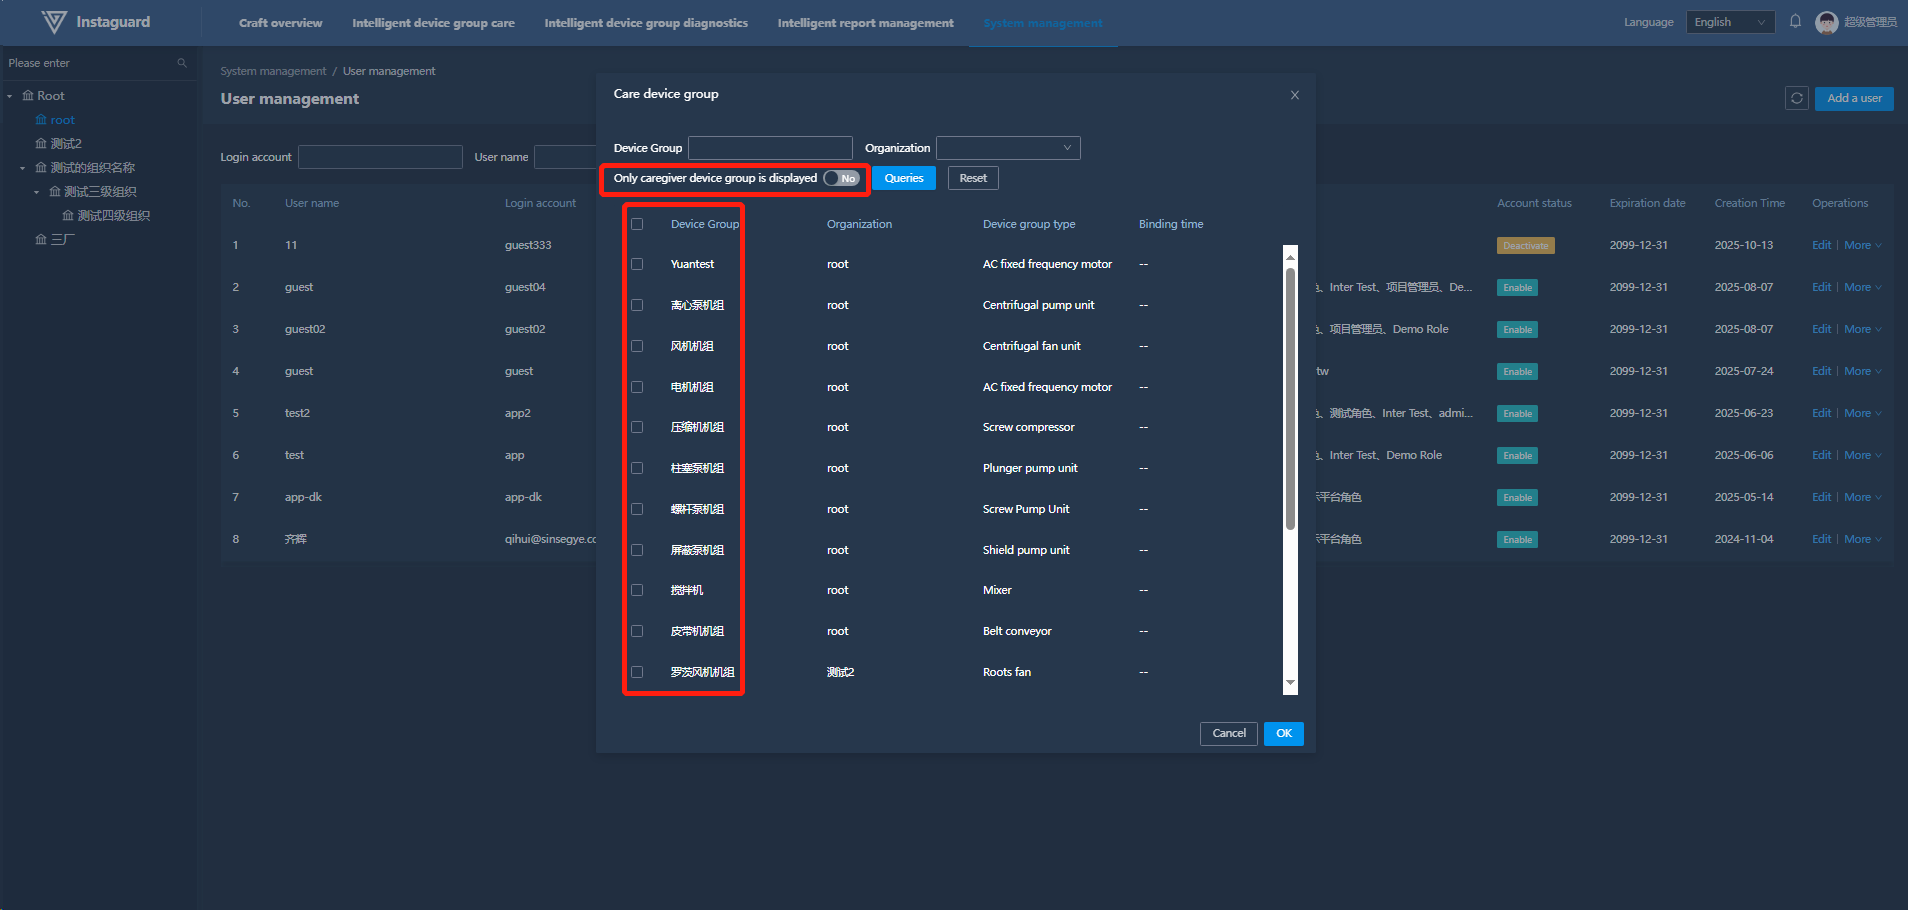
4.6 Setting Cared Units
Click "Cared Units" in User Management to configure message reception scope. Search units by name/organization or switch via the "Only Show Cared Units" slider.
4.7 Email Activation and Email Change
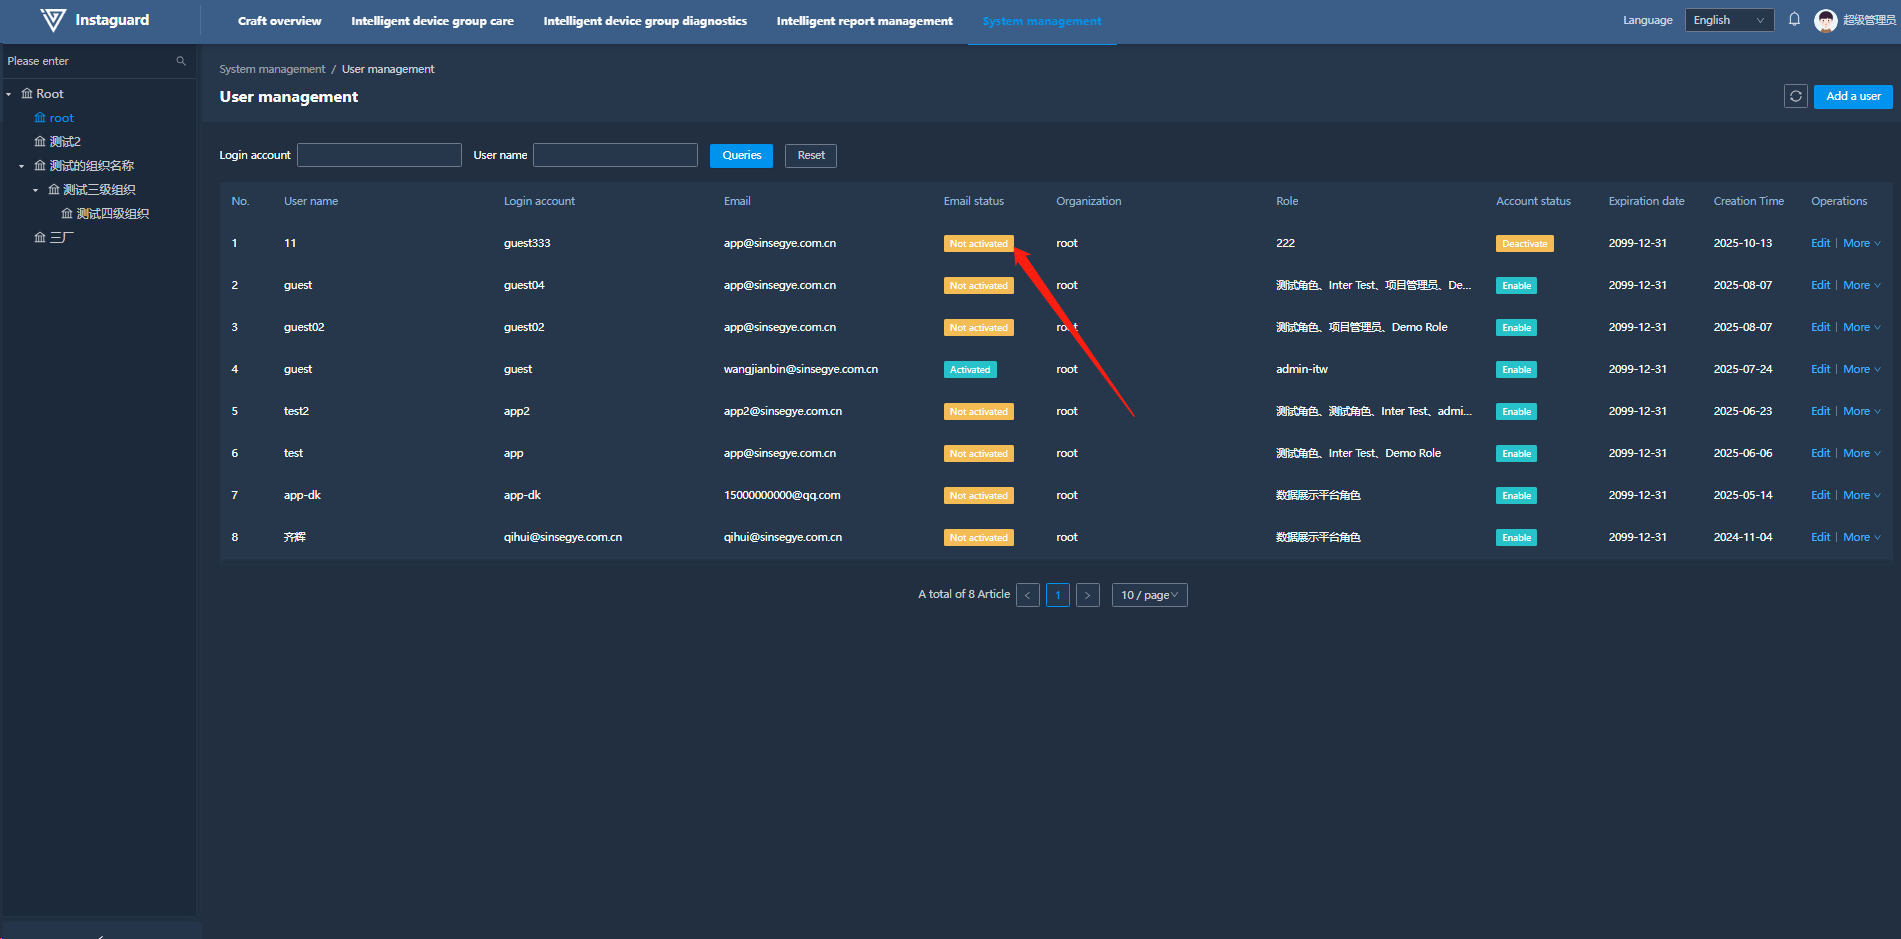
When an administrator creates a new user, the email status defaults to "Inactive." Existing users' emails are also in an inactive state. Users need to log in to the platform and activate their email addresses themselves. Users with inactive email addresses will not receive notifications from the email system (such as alerts or password reset emails).
4.7.1 Email Activation
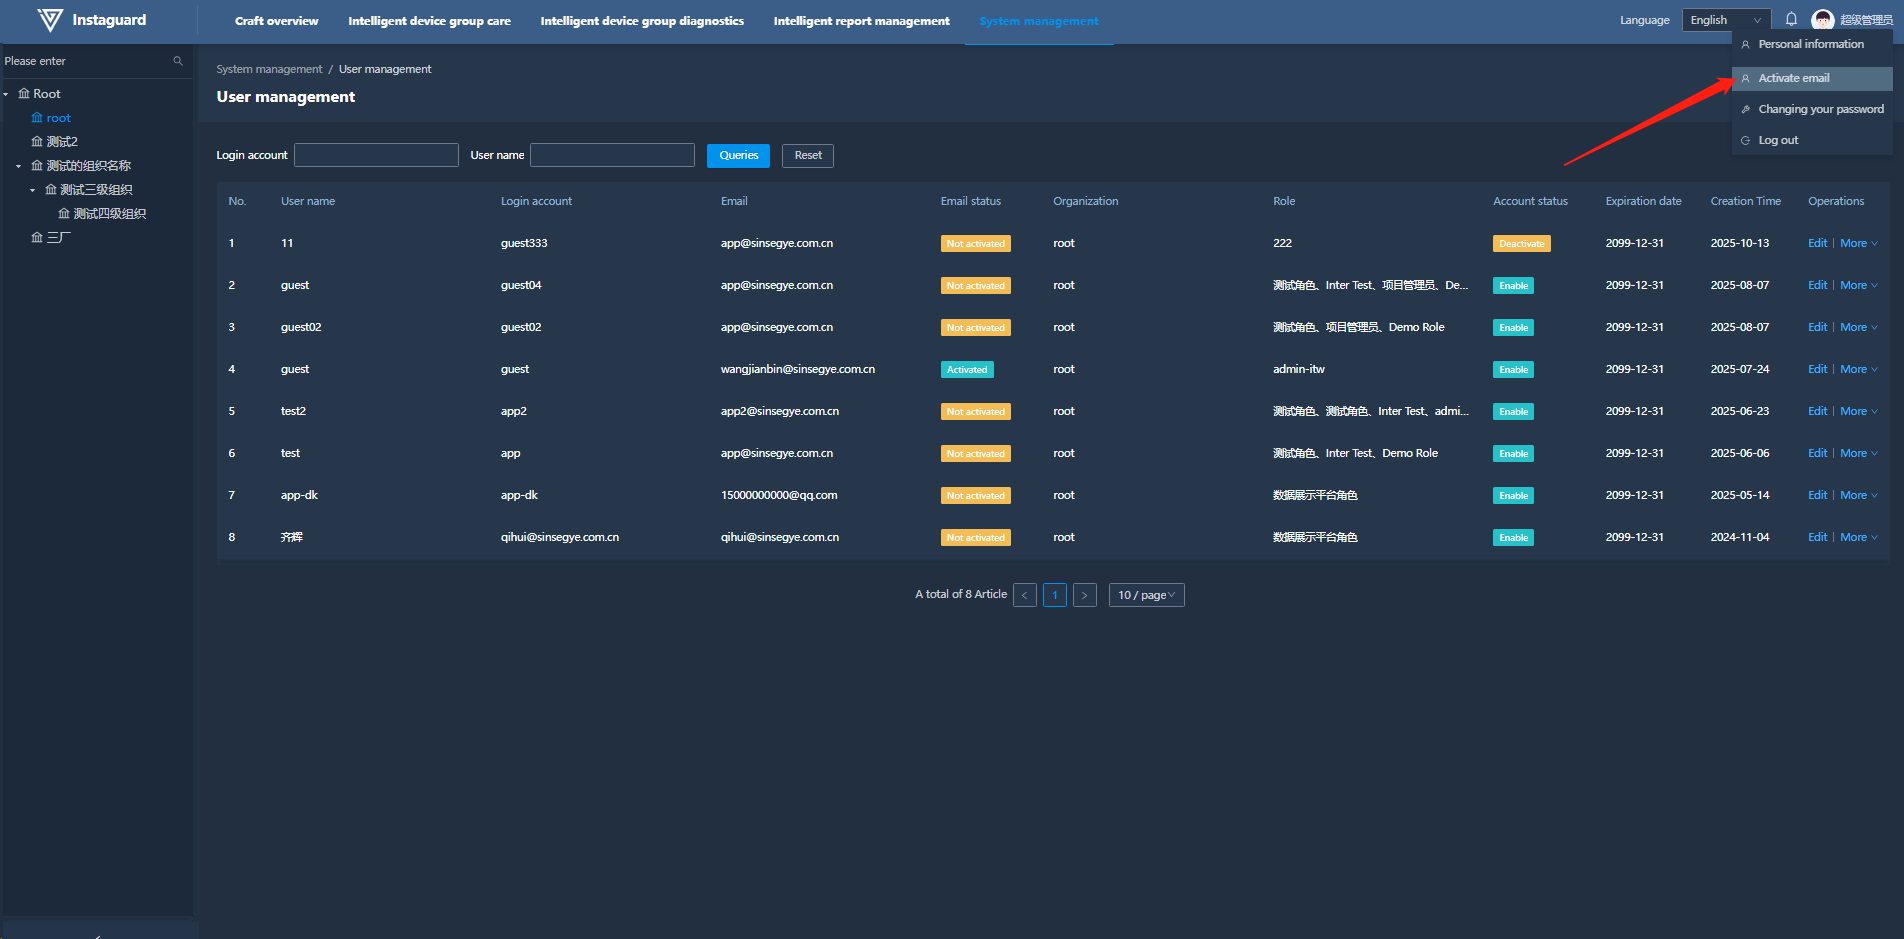
Path: Top-right corner user avatar → Activate Email
Steps:
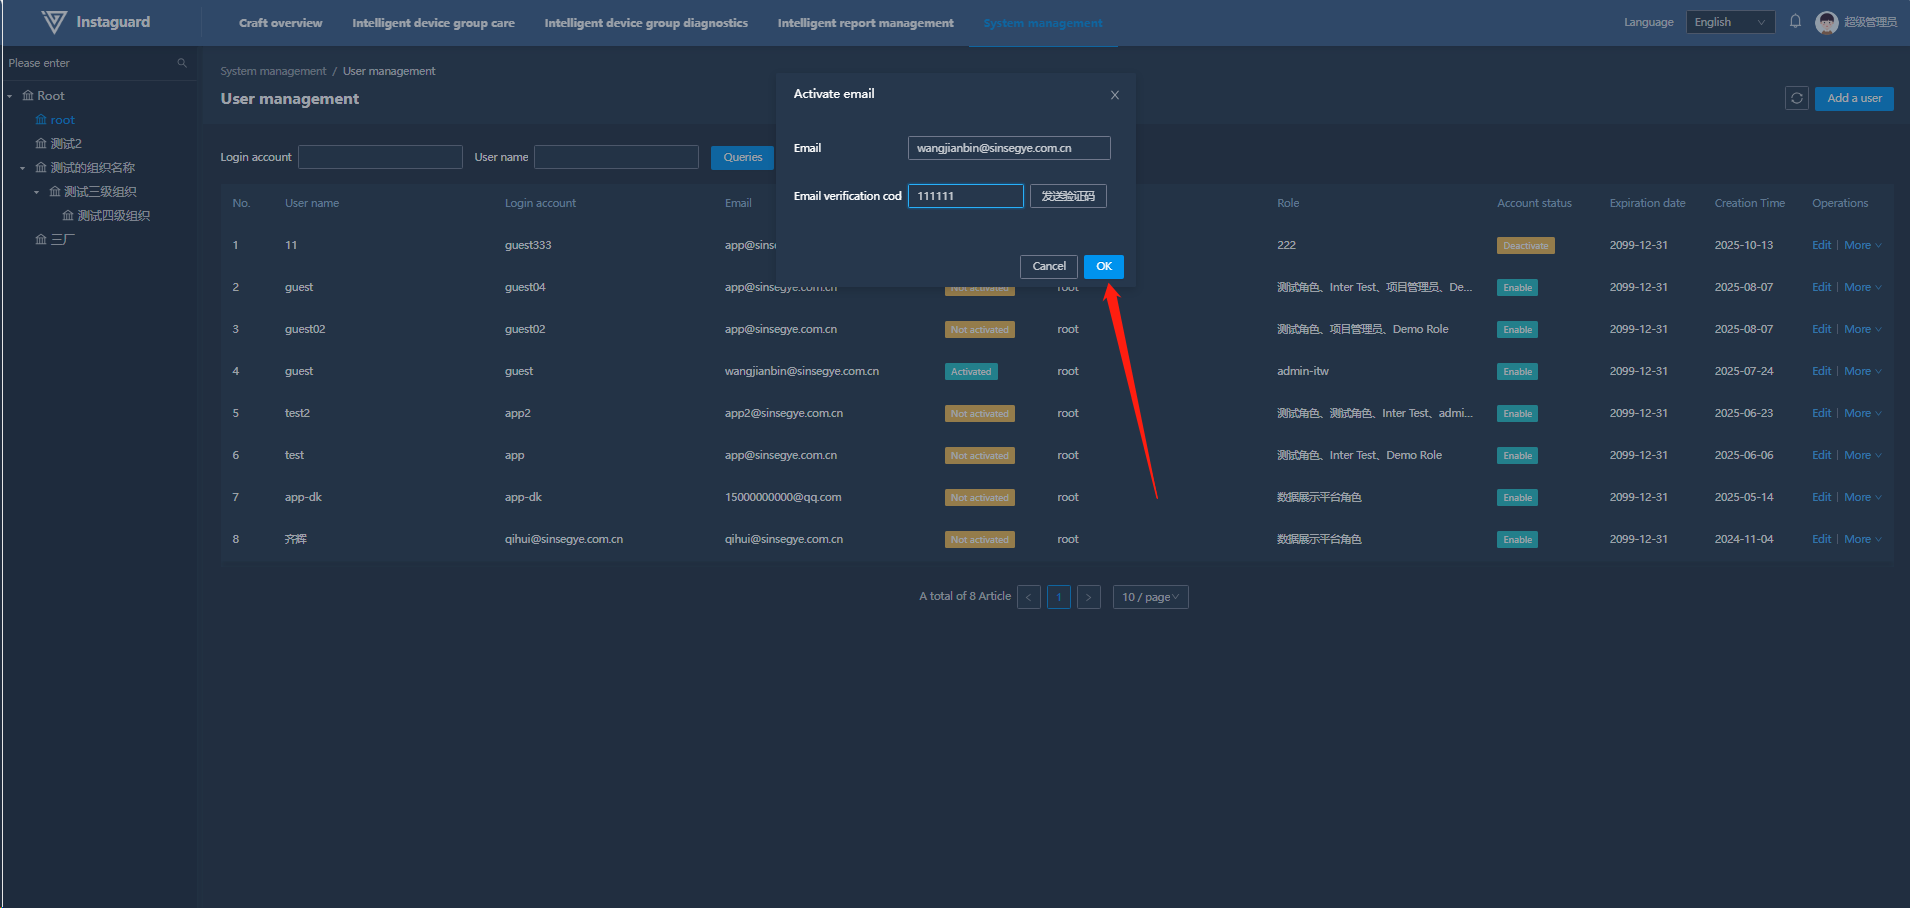
1.Click "Send Verification Code." A 60-second countdown will begin, after which the code can be resent. Check the email inbox (including the junk folder) to obtain the 6-digit verification code.
2.Enter the verification code. The system validates it in real-time: ✅ Verification successful, ❌ Verification code error.
3.After successful verification, click "Confirm." The email status will be updated to "Activated."
4.7.2 Email Change
Path: User Avatar → Change Email
The process is the same as activating the email, requiring confirmation via the new email's verification code.